Alibaba Dragonwell 8 Primer
In this blog, we'll explore the newly announced Dragonwell 8, how to install and use it, and how to join the development community.
- This blog is a translation from the English version. You can check the original from here. We use some machine translation. We would appreciate it if you could point out any translation errors. *
What is Alibaba Dragonwell 8?
Alibaba Dragonwell 8 is a free distribution version of OpenJDK, which provides long-term support from Alibaba Cloud, including performance improvements and security fixes. Alibaba Dragonwell 8 currently supports the X86-64 / Linux platform. With the addition of Dragonwell 8, you can significantly improve the stability, efficiency, and performance of deploying large Java applications in your data center. Alibaba Dragonwell 8 is a "friendly fork" under the same license terms as the OpenJDK Project and is a [Java SE Standard]. Compatible with (https://www.oracle.com/java/). Users can use Alibaba Dragonwell 8 to develop and run Java applications. The open source Alibaba Dragonwell 8 is an open source version of AJDK, a customized version of OpenJDK used internally by Alibaba Group. Optimized for e-commerce, finance and logistics based on business scenarios, AJDK operates in a very large Alibaba data center with over 100,000 servers.
How to install Alibaba Dragonwell 8
Currently, Alibaba Dragonwell 8 only supports Linux x86-64 platforms and offers a compiled binary JDK package. To install Alibaba Dragonwell 8, there are two steps:
- Download the compiled binary JDK package from the download page under Alibaba Dragonwell 8 on GitHub.
- Unzip the downloaded tar package into the installation directory.
Once the installation is complete, simply point the JAVA_HOME referenced by your application to the Alibaba Dragonwell 8 installation directory. Considering Tomcat 8.5.39, for example, to run Tomcat on Alibaba Dragonwell 8, simply run the following command when you start Tomcat.
JAVA_HOME=/path/to/dragonwell8/installation sh tomcat/bin/catalina.sh start
To verify that Tomcat is actually running on Alibaba Dragonwell 8, you can add the -showversion parameter to its Java command to display the JDK version information.
JAVA_HOME=/path/to/dragonwell8/installation JAVA_OPTS="-showversion" sh tomcat/bin/catalina.sh start
When you start Tomcat, the version information of Alibaba Dragonwell 8 is displayed at the beginning of the tomcat / logs / catalina.out file.

How to use Alibaba Dragonwell 8
This section describes how to take advantage of the various features of Alibaba Cloud Dragonwell 8. Currently, the preview view of Dragonwell 8 offers two features that are internally in full operation mode on Alibaba Group. JWarmUp and Java Flight Recorder. For both features, JEPs or patches have been submitted to the OpenJDK community. We expect Alibaba Dragonwell 8 users to be able to take advantage of these two features in advance before the upstream merge is complete.
Quickly warm up your Java application with JWarmUp
OpenJDK employs JIT (Just-in-Time) compilation technology, which compiles Java bytecodes into dynamically optimized machine code to improve execution efficiency. However, before this compilation is complete, the Java code runs in interpreted mode, which is relatively inefficient.
When an application is launched and business traffic is just coming in, many Java methods are likely to start compiling using the JIT and the business request is being executed by a slow interpreter. The end result of this symptom is a very high system load and many user request timeouts. Many previous solutions to this problem have been to use simulated traffic to warm up the application. The JWarmUp feature provides a new option to resolve this issue: warming up the current application to run using a record of the previous run and compilation of the Java virtual machine.
The following figure shows how JWarmUp works.

A typical application scenario for JWarmUp is to release a new application version.
- JWarmUp first runs a Java application on one machine in a beta environment for a short time, and records and collects metadata of the actions taken by the JIT compiler during that time.
- Next, JWarmUp copies the retrieved metadata to each production machine / container that contains the new version of the code.
- Finally, the metadata generated in the beta environment uses the JWarmUp parameter to guide the production machine to complete the JIT warmup in the process of launching the application. Will be loaded into.
This way, your application will perform best when requested by the user.
Collecting warm-up data
Again, taking Tomcat as an example, you can add the following command line parameters to collect the metadata generated in the beta environment during JIT compilation, and the -XX: CompilationWarmUpLogfile = parameter will be generated. Specify the path of the JWarmUp file.
JAVA_HOME=/path/to/dragonwell8/installation JAVA_OPTS="-XX:ReservedCodeCacheSize=512m -XX:CompilationWarmUpLogfile=$PWD/jwarmup.log -XX:+CompilationWarmUpRecording -XX:+CompilationWarmUp -XX:-TieredCompilation -XX:+DeoptimizeBeforeWarmUp -XX:CompilationWarmUpDeoptTime=30 -XX:+PrintCompilationWarmUpDetail" sh bin/catalina.sh start
Following this, this generated file can be sent to the machine in production using OSS, SFTP, or other methods.
Warm up Java applications with recorded data
On a production machine, you can launch a new instance of Tomcat using the previous warm-up data by simply using the following parameters: The xx: CompilationWarmUpLogfile = parameter specifies the path to the JWarmUp file to load. This file must have been copied from the beta environment in the previous step in order to collect the warmup data.
JAVA_HOME=/path/to/dragonwell8/installation JAVA_OPTS="-XX:ReservedCodeCacheSize=512m -XX:CompilationWarmUpLogfile=$PWD/jwarmup.log -XX:+CompilationWarmUp -XX:-TieredCompilation -XX:+DeoptimizeBeforeWarmUp -XX:CompilationWarmUpDeoptTime=30 -XX:+PrintCompilationWarmUpDetail" sh bin/catalina.sh start
Use Java Flight Recorder to analyze Java application performance
JFR (Java Flight Recorder) is an event-based performance analysis function built into the JVM. This commercial feature is available from Oracle JDK 7u4. This feature was open sourced in JDK 11 in 2018. However, it is not supported in JDK8.
Alibaba is working with companies such as Red Hat, Azul, and Amazon to add support for this feature to JDK 8. However, this patch is not currently merged into OpenJDK8u. To get support for this feature in advance, Alibaba Dragonwell 8 provides a JFR version ported by Alibaba.
Using JFR is very easy. Simply use command line parameters and jcmd commands to control your HotSpot and generate performance data in a file. You can then use the open source JMC tools to open and analyze the generated files in the graphics interface.
Collect performance data using JFR
By default, Alibaba Dragonwell 8 has the JFR feature disabled. To enable the JFR feature, you need to add the command line parameter -XX: + EnableJFR. Alibaba Dragonwell 8 offers several options for using JFR to collect performance data.
You can use command line parameters in your application to specify that JFR should start collecting performance data immediately after the application is launched. This is useful for diagnosing startup problems. The code in the following example collects JFR data for one minute when the Java process's JFR module is initialized and returns that data in a file named rec.jfr.
JAVA_HOME=/path/to/dragonwell8/installation JAVA_OPTS="-XX:+EnableJFR -XX:StartFlightRecording=duration=1m,filename=rec.jfr" sh bin/catalina.sh start
You can also add just -XX: + EnableJFR to your application and use the jcmd command to collect data at any time after the application starts.
For example, you can start Tomcat with the following command.
JAVA_HOME=/path/to/dragonwell8/installation JAVA_OPTS="-XX:+EnableJFR" sh bin/catalina.sh start
To collect the data for analysis, simply run the corresponding jcmd command from JFR using the PID of the Tomcat process you are analyzing. For example, Tomcat uses the following command to collect data for 10 seconds from a particular point in time.
$ ps ax | grep tomcat
 77522 pts/18   Sl+    0:08 /home/chuansheng.lcs/dw_test/apache-tomcat-8.5.39/../j2sdk-image/bin/java -Djava.util.logging.config.file=/home/chuansheng.lcs/dw_test/apache-tomcat-8.5.39/conf/logging.properties -Djava.util.logging.manager=org.apache.juli.ClassLoaderLogManager -XX:+EnableJFR -Djdk.tls.ephemeralDHKeySize=2048 -Djava.protocol.handler.pkgs=org.apache.catalina.webresources -Dorg.apache.catalina.security.SecurityListener.UMASK=0027 -Dignore.endorsed.dirs= -classpath /home/chuansheng.lcs/dw_test/apache-tomcat-8.5.39/bin/bootstrap.jar:/home/chuansheng.lcs/dw_test/apache-tomcat-8.5.39/bin/tomcat-juli.jar -Dcatalina.base=/home/chuansheng.lcs/dw_test/apache-tomcat-8.5.39 -Dcatalina.home=/home/chuansheng.lcs/dw_test/apache-tomcat-8.5.39 -Djava.io.tmpdir=/home/chuansheng.lcs/dw_test/apache-tomcat-8.5.39/temp org.apache.catalina.startup.Bootstrap start
 98451 pts/22   S+     0:00 grep --color=auto tomcat

$ dragonwell8_home/bin/jcmd 77522 JFR.start duration=10s filename=$PWD/rec3.jfr
77522:
Started recording 3. The result will be written to:

/home/my/workdir/rec3.jfr
After 10 seconds, the /home/my/workdir/rec3.jfr JFR file will be generated. You can parse the file with JMC.
You can also launch JFR directly to collect data without specifying a data collection period and manually dump all generated data to a file if needed.
$ dragonwell8_home/bin/jcmd 2823 JFR.start filename=$PWD/rec4.jfr
2823:
Started recording 4. No limit specified, using maxsize=250MB as default.

Use JFR.dump name=4 to copy recording data to file.

$ dragonwell8_home/bin/jcmd 2823 JFR.dump name=4 filename=rec4.jfr
2823:
Dumped recording "Recording-4", 332.7 kB written to:

/path/to/my/workdir/rec4.jfr
Use JMC for performance analysis
JFR records Java application performance data in binary files. JMC (Java Mission Control) allows you to analyze a particular set of performance data with a graphics interface. JMC is an open source tool. Not included in Alibaba Dragonwell 8. To use this tool, download it from the OpenJDK official website https://jdk.java.net/jmc/. please.
Note that JMC 7.0 or later is required to analyze JFR data files generated using Alibaba Dragonwell 8.
After opening the JMC, you can click on a specific item on the left to analyze the events that occurred during sampling in detail.

Diagnostic and debugging support
Alibaba Dragonwell 8 also includes some useful diagnostic features described below.
Alert function for large object allocation
The new JVM parameter -XX: ArrayAllocationWarningSize = can be used for this purpose. For example, the code below assigns a relatively large array.
public static void main(String[] args) {
    doAlloc(32 * 1024 * 1024 + 1);
}
private static Object doAlloc(int size) {
    return new byte[size];
}
Adding the ʻArrayAllocationWarningSize` option during code execution will display the Java stack running while this array is allocated.

Detailed support for ParNew GC logs
By default, Alibaba Dragonwell 8 uses the CMS (Concurrent Mark Sweep) algorithm, and young generation uses the ParNew algorithm. That's why the ParNew GC log provides two built-in enhancements.
--You can use the jinfo tool to set the PrintYoungGenHistoAfterParNewGC option so that you can print an object histogram for the young generation at the end of the next Young GC. To do this, use the following command:
jinfo -flag +PrintYoungGenHistoAfterParNewGC <pid>
After this print operation is complete, this option is set back to false to prevent too much output. The following is a typical output example.

--You can use -XX: + PrintGCRootsTraceTime to print details of the CPU time it takes to process each type of GC route set. The following is an example output.

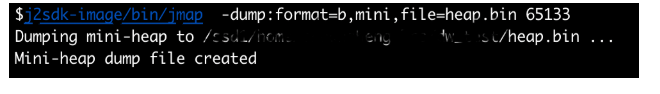
Supports rationalization of Heap Dumps
Alibaba Dragonwell 8's jmap tool supports a new dump option mini, which allows you to skip the contents of all arrays of the original type when generating HeapDump. This option significantly reduces the size of the generated HeapDump file, which is especially useful in scenarios where you only need to check the relationship between types and objects.
The following figure shows a code sample.
Participate in building the Alibaba Dragonwell community
The Alibaba Dragonwell community provides long-term support for the JDK version. You can get support, participate in discussions, and share ideas on the following channels:
Issues page of Alibaba Dragonwell project on GitHub
References
[1] Official Oracle Java 8 documentation: https://docs.oracle.com/javase/8/ [2] OpenJDK 8 Project Home Page: https://openjdk.java.net/projects/jdk8u/ [3] Alibaba Dragonwell 8 Project: https://github.com/alibaba/dragonwell8 [4] Alibaba Dragonwell 8 Developer Guide: https://github.com/alibaba/dragonwell8/wiki/Developer-Guide
- Alibaba Cloud is the No. 1 (2019 Gartner) cloud infrastructure operator in the Asia Pacific region with two data centers in Japan and more than 60 availability zones in the world. Click here for more information on Alibaba Cloud. Alibaba Cloud Japan Official Page *
Recommended Posts