[Hands-on for beginners] Read kaggle's "Predicting Home Prices" line by line (Part 2: Checking Missing Values)
theme
Click here for the first content This is the second part of a project to make a note of the contents of hands-on, in which everyone will challenge the famous "House Price" problem of kaggle. It's more of a memo than a commentary, but I hope it helps someone somewhere.
- Original theme: https://www.kaggle.com/c/house-prices-advanced-regression-techniques
- Referenced article: https://yolo-kiyoshi.com/2018/12/17/post-1003/
Today's work
Confirmation of missing values (cannot be completed)
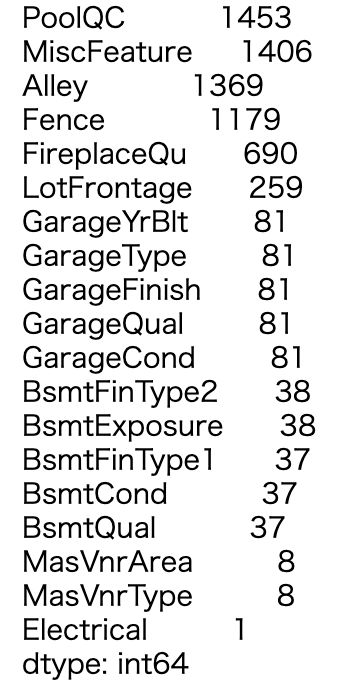
In conclusion, it seems that there are quite a few missing values.
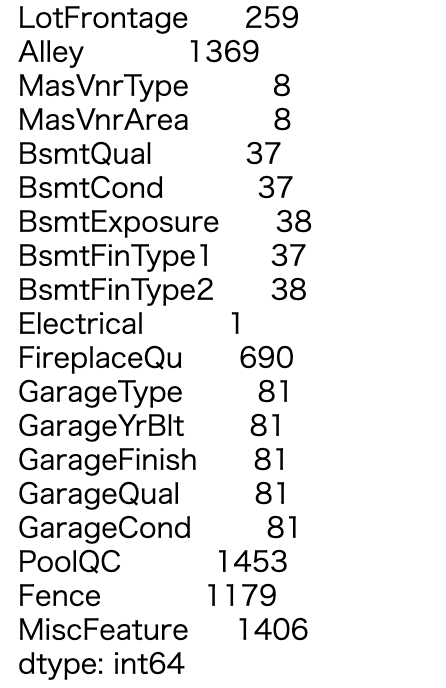
Missing status of training data (missing value)
train.isnull().sum()[train.isnull().sum()>0].sort_values(ascending=False)
Missing value
- What is a "missing value" in the first place: https://www.weblio.jp/content/%E6%AC%A0%E6%90%8D%E5%80%A4
When preparing the data file, you must enter some numerical value even if the data is missing. However, the entered numerical value indicates that there was actually no data, so it is necessary to exclude it from the analysis target. Therefore, enter a value (missing value) that can be clearly distinguished from other valid data.
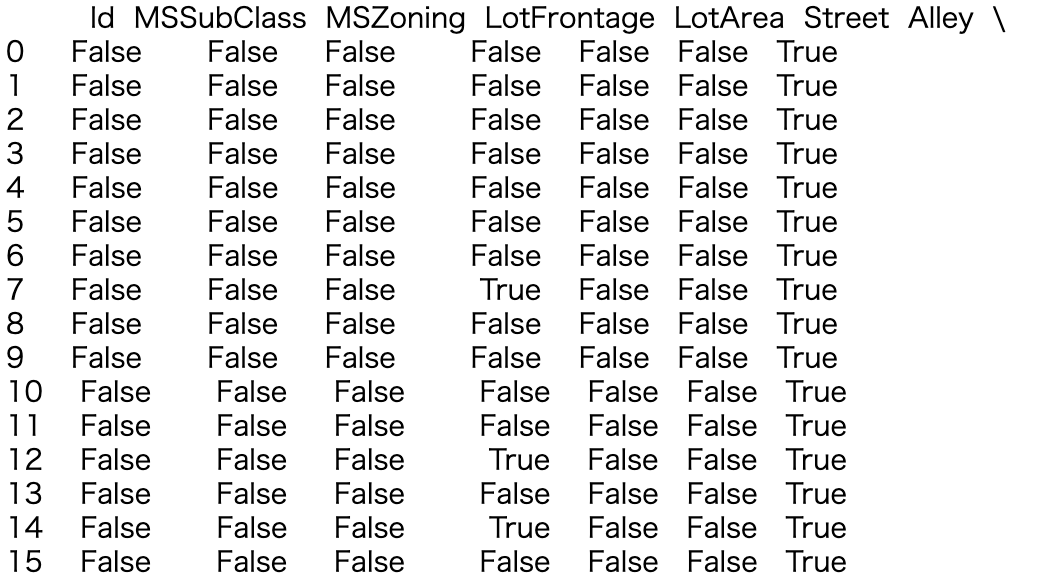
.isnull()
- .isnull (): It checks whether the value is entered as true or false for each element.
- Reference: https://note.nkmk.me/python-pandas-nan-judge-count/
- When the result is output only by train.isnull ()
.sum()
-
.sum (): Familiar addition. It adds up both vertically and horizontally by specifying an argument.
-
Reference: https://deepage.net/features/pandas-sum.html
-
When the result is output only by train.isnull (). Sum ()
-
[train.isnull (). sum ()> 0]: Feeling that only columns with missing items are specified as keys and arranged.
-
When the result is output only by train.isnull (). Sum () [train.isnull (). Sum ()> 0]
.sort_values()
- .sort_values (ascending = False): Data sort. Here, only the arguments to be sorted in descending order are specified, but it seems that you can select the items to sort or change the algorithm. Convenient.
- Reference: https://deepage.net/features/pandas-sort-values.html
- Display only by train.isnull (). sum () [train.isnull (). sum ()> 0] .sort_values (ascending = False)
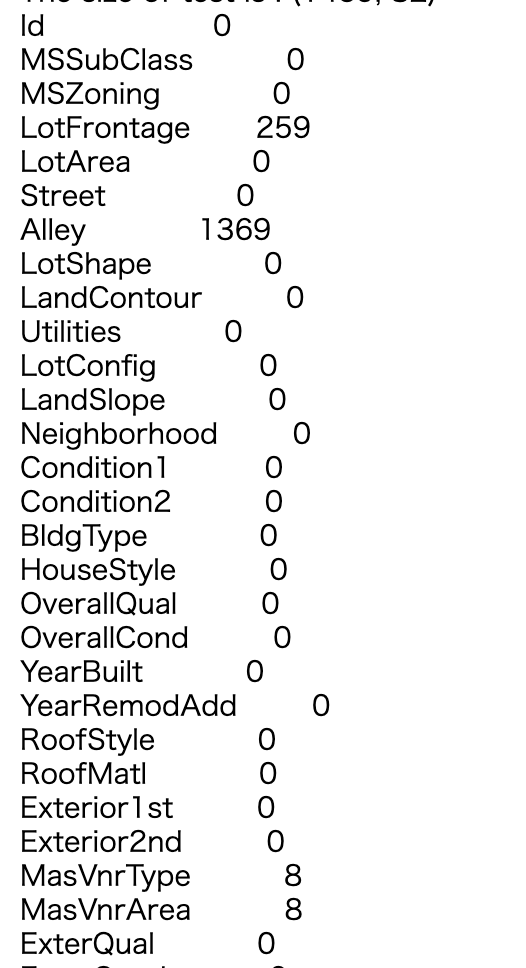
Missing test data
The explanation is the same as the learning data, so I will omit it.
test.isnull().sum()[test.isnull().sum()>0].sort_values(ascending=False)
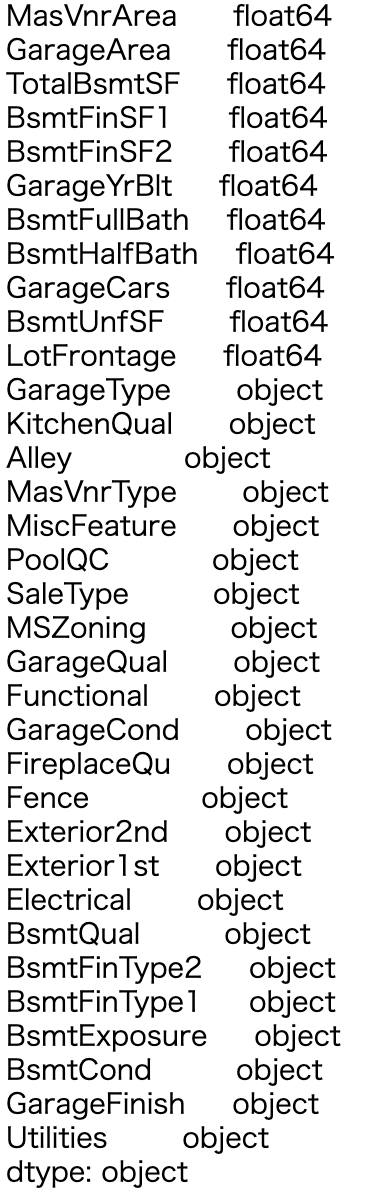
Missing status of training data (data type)
.index.tolist()
#Check the data type of the column containing the missing
na_col_list = alldata.isnull().sum()[alldata.isnull().sum()>0].index.tolist() #List columns containing defects
alldata[na_col_list].dtypes.sort_values() #Data type
- ʻAlldata.isnull (). sum () [alldata.isnull (). sum ()> 0] `I have omitted the contents up to the point where the missing values are lined up.
- .index: Is this different from ʻindex ()`? I thought, but it seems different.
- .tolist (): I used this again to list only columns. (Slightly ambiguous)
- Reference: https://note.nkmk.me/python-pandas-list/
- Output result of
na_col_list = alldata.isnull (). Sum () [alldata.isnull (). Sum ()> 0] .index.tolist ()
.dtypes
- .dtypes: If you apply this to an array, it will check each data type. Convenient. There is also a similar dtype.
- Reference: https://www.sejuku.net/blog/62023
- ʻAlldata [na_col_list] .dtypes` output result (* The contents of sort_values () are omitted, in ascending order)
Understanding and dealing with deficiency situations
This is a description of opinions on how to handle data statistically. We recommend that you read and understand it normally. A story different from programming understanding.
Both training data and test data are considerably missing. In such a case, you will want to delete the column with many defects. But before that, Kaggle has a document that details variables, so let's take a look at it first. When you download the data from Kaggle, you will notice that it also contains a file called "data_description.txt". This file details what data is stored in the variables. Then we know that the majority of deficiencies do not mean that there is no information, but that the deficiencies themselves are information. For example, take a look at PoolQC (pool quality), which has the most defects. The loss of this variable means that the pool does not exist in the house, and the data loss itself is information. For other variables (categorical variables) as well, a deficiency simply means that the facility or equipment does not exist. Also, for numeric variables, the deficiency only means that the occupied area is zero, and it is not without information. Therefore, the following completion is performed for the loss of categorical variables and numeric variables.
That's it.
Hmmm. I just looked at the data.