First portfolio (technology <production process)
I'm Shione Ueno, who has been programming for half a year. At the school, I was mainly taught how to make Rails apps, and now I am working at Wilico Co., Ltd. while being taken care of as an intern. I'm new to programming and writing, so please let me know if you have any questions.
This time, I would like to write down various things about the portfolio created in the third month of school, although it will be miscellaneous.
Portfolio overview
- Easy login ("Sign in as a trial user") has been implemented.
It was created assuming a QA site for the development community. See the README on github for details.
Development history and purpose
There are two main things I wanted to learn this time.
: thinking: ** What kind of data is collected through user actions? ** ** : thinking: ** What kind of analysis results can be returned based on the data? ** **
Originally, I decided to ** give a rating to the user → absolutely implement the function of displaying on the chart **. I was interested in AI (data statistics and analysis) as a trigger, so at first I was thinking of doing something using Python, but I rejected it. The reason is
- I felt that even if a beginner could acquire a new technology and create an app with a time limit of one month, it would not be a strong portfolio.
- The understanding of Rails that was being taught at that time was clearly shallow, and I couldn't help but try another technology with that level of understanding.
That's why I planned the app while glancing at some sites. The reason why I came up with the QA site was that I could imagine how to set the evaluation criteria.
DB design
: bulb: ** It's best to store only static (immutable) data! ** ** That is what I learned this time. Development is implemented in SQLite3, and production is implemented in MySQL.
What I was thinking at the beginning
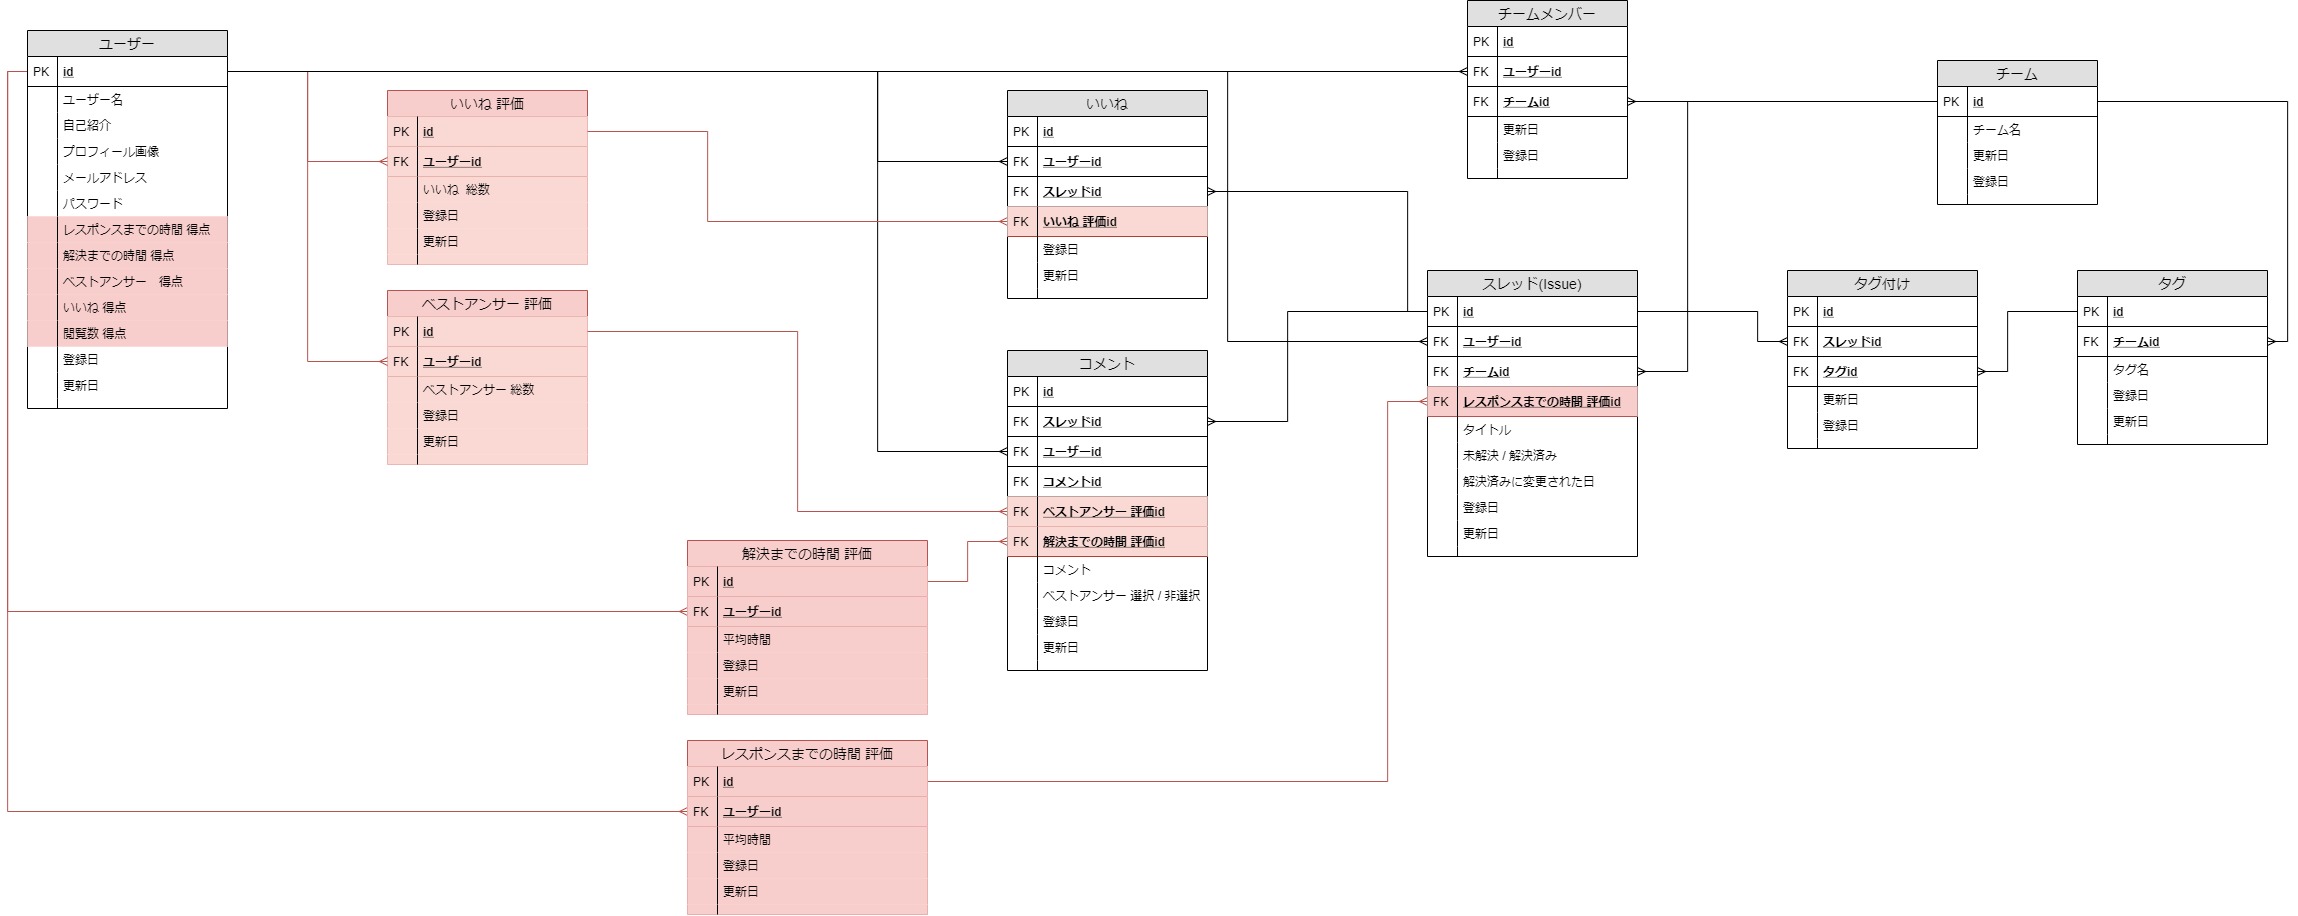
I was planning to update the user's evaluation in the user table, and other evaluations in association with comments and thread actions, but I got confused on the way and consulted with the school mentor. The big problem, apart from all that, is that ** with this design, it may not be updated properly because it will be updated every time the user operates something **. (There seem to be various ways to avoid it, but I want to dig deeper, so I will omit it)
Data that can be calculated later and data that is frequently updated depending on the user's behavior are not managed in the DB unless there is a reason, so ** Save only the material for analysis and draw the chart It is designed to be calculated at the timing. ** **
Final design
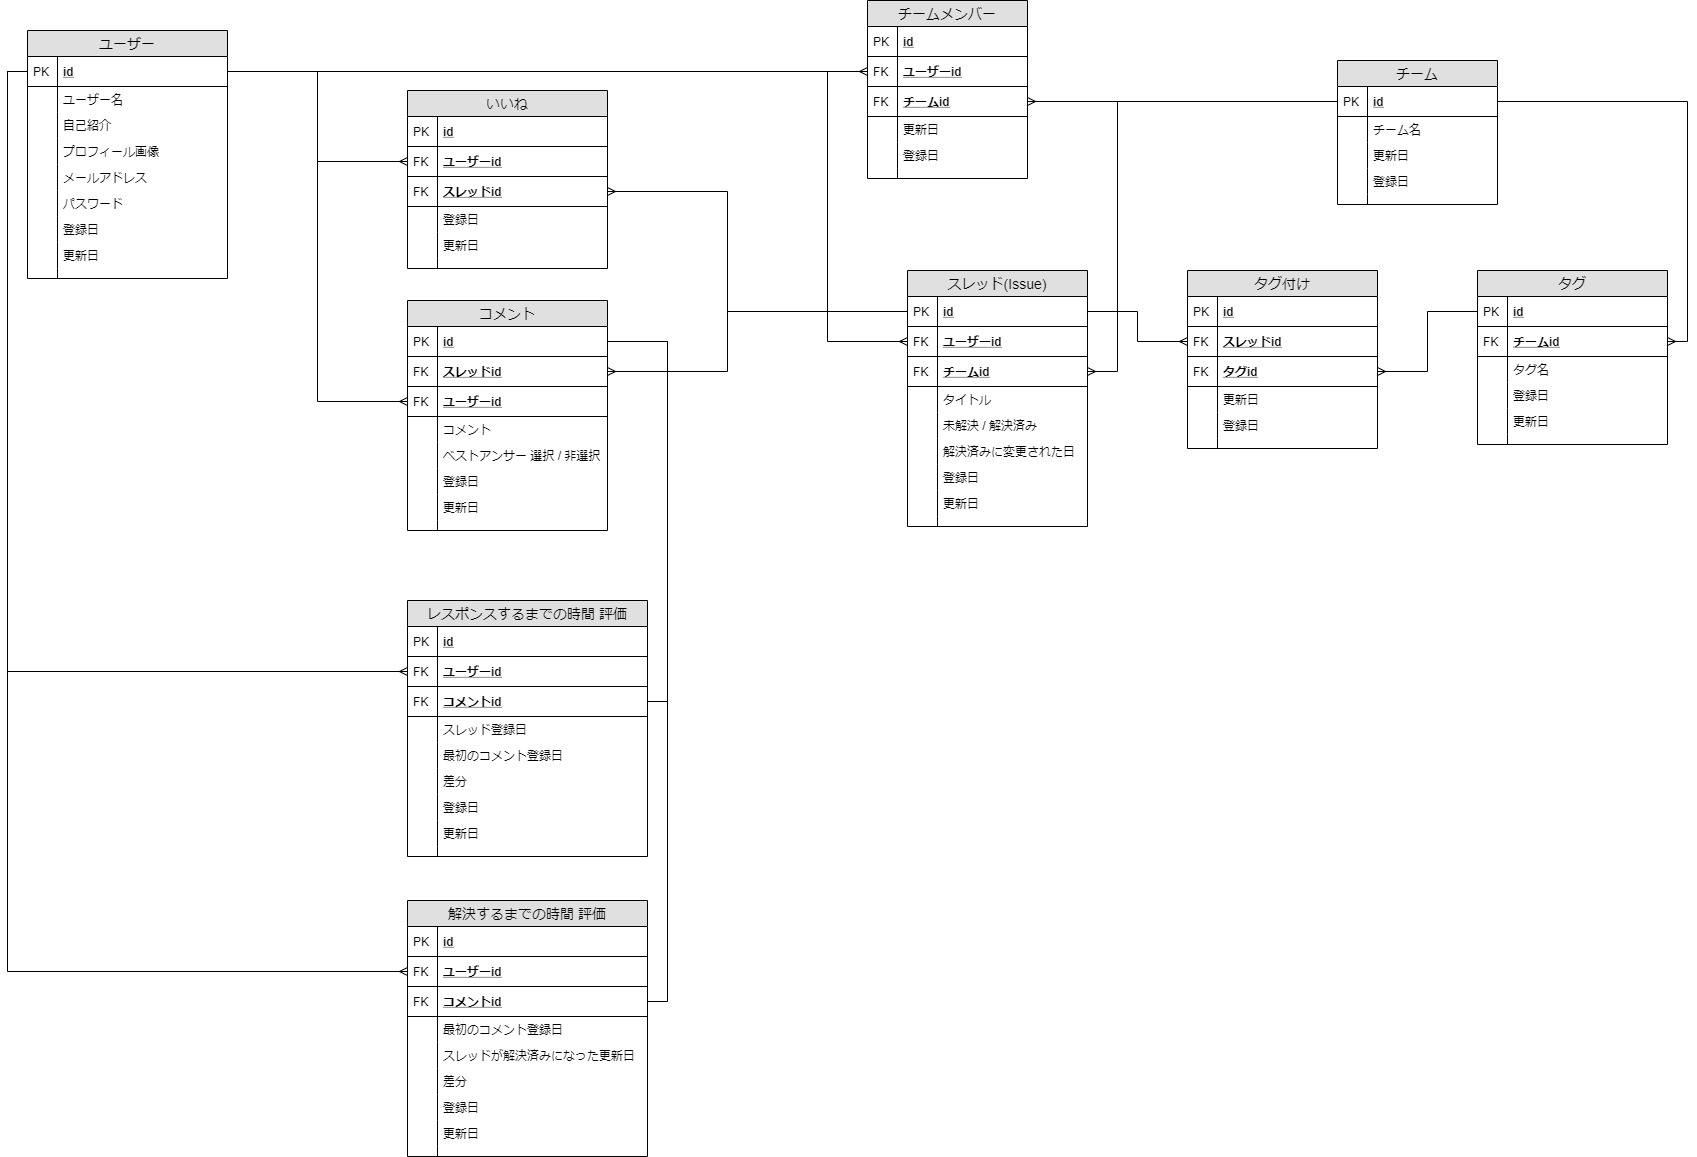
The red part has been erased, but there is one more step to calculate the time-based evaluation compared to other evaluations (calculate the difference based on the registration date registered in the two tables → based on the difference Since the average value is calculated), the table is left for different purposes in order to speed up the aggregation.
Implementation of basic functions
This is the part excluding the chart implementation. I wanted to spend some time on the chart, so I implemented a schedule other than the search function in about a week. Well, I have not implemented difficult functions, so to give an appealing point, : information_desk_person: ** Tagging and search features implemented without gems ** When I looked it up again, I thought, "Maybe it was made with gem ...?", But it was a good exercise (?), So the result is all right: confetti_ball:
Remarks below
--Tagging function
――If data with the same meaning but different notation (rails, Rails, etc.) is entered, the accuracy of analysis will decrease, so ** I wanted to make the operation of new tag creation heavier **.
――I was worried that it was light because I could only find a way to write in one text_field separated by commas, so I decided that it would be a more familiar way to make a form by connecting it with an intermediate table.
――After implementation, I saw the tagging function of Qiita and peeled it off. I see. Did you have this hand? I see…
--Search function
--I wanted to be able to search by specifying conditions in a little more detail, such as search target and each resolved / unresolved flag **.
--If you look it up again, [Advanced Mode](http://nekorails.hatenablog.com/entry/2017/05/31/173925#031-%E3%82%A2%E3%83%89%E3%83% 90% E3% 83% B3% E3% 82% B9% E3% 83% 88% E3% 83% A2% E3% 83% BC% E3% 83% 89% E3% 81% A8% E3% 81% AF) It looks like it can be done. I tried to touch it at that time, but decided that it was faster to implement it by myself than to understand this mode. (Conditional branching has already been implemented in the school's application tasks, or search is implemented by referring to this site.)
--Tagging function ――If data with the same meaning but different notation (rails, Rails, etc.) is entered, the accuracy of analysis will decrease, so ** I wanted to make the operation of new tag creation heavier **. ――I was worried that it was light because I could only find a way to write in one text_field separated by commas, so I decided that it would be a more familiar way to make a form by connecting it with an intermediate table. ――After implementation, I saw the tagging function of Qiita and peeled it off. I see. Did you have this hand? I see… --Search function --I wanted to be able to search by specifying conditions in a little more detail, such as search target and each resolved / unresolved flag **. --If you look it up again, [Advanced Mode](http://nekorails.hatenablog.com/entry/2017/05/31/173925#031-%E3%82%A2%E3%83%89%E3%83% 90% E3% 83% B3% E3% 82% B9% E3% 83% 88% E3% 83% A2% E3% 83% BC% E3% 83% 89% E3% 81% A8% E3% 81% AF) It looks like it can be done. I tried to touch it at that time, but decided that it was faster to implement it by myself than to understand this mode. (Conditional branching has already been implemented in the school's application tasks, or search is implemented by referring to this site.)
Chart implementation
As the development process, ~~ What you can do now ~~ → I want to do this! Since I made a plan based on the axis and came to this point, I had almost no plans for detailed implementation in the spirit of doing it. I looked it up, but at that time I was too unfamiliar with js and was on the verge of fainting in agony.
: fearful: << ** What and how can I do this ...? ** ** Even though I thought about the app myself, I came here and quietly despaired in the corner of the classroom.
The big thing I learned at this time was : raised_hands: ** I don't know, the importance of touching something for the first time **
While I was mourning because I didn't understand anything, when I consulted with my school classmates, he told me chart.js codepen. The moment I touch it a little, I can read chart.js so much that it is interesting. I think the main factor was touching the already completed code. You can intuitively understand which value affects the data of which axis, which value affects which design, etc., and if you pass the array here, you will win! I was able to set a goal.
I think it's a bit reckless, but I'm glad I moved to the implementation gracefully because I worked hard on the basic functions to devote man-hours including trial and error (results theory).
Now, always implement charts
Data is exchanged with the js file at gem'gon'. It is basically converted to json format, but it is not included in the learning purpose, and I chose it because I could not read the man-hours of the chart to be implemented and wanted to emphasize speed.
Generally like this.
- Create a method to calculate the array to be passed to the chart with the logic of UserModel, call it with Controller
- Pass to gon with Users Controller
- In View, gon tag → pass to js file
- Pass the js file → canvas tag to draw the chart
- I picked it up to grasp the flow. I would like to deepen my understanding while verifying a little more around gon.
The logic of UserModel is roughly like this.
Since the code is a little long, I write it as if only the flow is transmitted: pray: What is the alternative, but I will post a Github link line by line, so please have a look if you are interested. Summarize by evaluation criteria.
:cactus: Questioner/Tags, Answer/Tags There are two items on the donut chart. Since the logic for pulling data is slightly different, we will use Questioner / Tags as an example.
- Calculate tags associated with issues posted by the target user
- Create an array containing only the tag names
- Calculate tags associated with issues posted by the target user
- Create an array containing only the percentage of tags
:cactus: Time to response, Time to solved, Total Bar chart and radar chart items. Since the table that pulls the data is different, let's take Time to response as an example. ** Basically this flow except for donut charts. ** Omit detailed processing.
- Calculate the average value of all users -Since the graph class changes depending on the user's behavior, the reference value is calculated based on this data.
- Calculate the values used to determine the charts -Returns [minimum value, maximum value, class width based on it] of each user average value. -If there is no posted issue, return it as false and handle the exception.
- Calculate the boundary value based on 2 ・ Users with 〇seconds to 〇seconds have a score of 1, and users with 〇seconds to 〇seconds have a score of 2….
- Based on the boundary value of 3
- Calculating how many users are included in each class and creating an array
- [Calculate whether or not the target user is included in each class by 0,1 and create an array](https://github.com/kanon2580/tot/blob/713f6e626a9b83712189a4289452ec3c1cc963a8/app/models/user. rb # L136-L140)
- Calculate user score based on array of 6 ・ In the case of 3 points, [0,0,1,0,0,0,0,0,0,0] → Turn with each_with_index and the second value will be 1 → Score calculation with 2 + 1
- Return 5,7 to Controller
-
- Only the radar chart array is created by Controller. -When calling a Model method from Controller, if you try to create an array on Model, the array will be reset each time you call it. -Since the array of [5 (value to be passed to the chart), 7 (user's score)] is the return value, pick up [1] of this array to create an array.
: cactus: etc.
Since it is almost the same as Time to response, only the difference is summarized.
** 1. Mean ** Since the absolute value was not large enough to calculate the average value, ** the total value is calculated. ** The value on the chart was only 0 and did not change: frowning2:
** 3. Class calculation ** The method to call is changed to bring the class error to score 1. It is important that the conditions for high scores diverge depending on the evaluation criteria. Time to ~ → 1. High score when the average value calculation result is ** Low ** → [calculate_evaluation_datas_sort_by_** max ](https://github.com/kanon2580/tot/blob/713f6e626a9b83712189a4289452ec3c1cc963a8/app/models/ user.rb # L74) Other than that → 1. High score when the total value calculation result is ** High ** → [calculate_evaluation_datas_sort_by_ min **](https://github.com/kanon2580/tot/blob/713f6e626a9b83712189a4289452ec3c1cc963a8/app/models/user .rb # L96) The major difference is that the criteria for determining the class is ** maximum value → minimum value ** (named based on this standard) and ** timing to reverse the array **.
Refactoring
The production period was from February 15th to March 15th, but we deployed the beta version at the beginning of March and received reviews from various people. Thank you: sob:
** UserModel method **
- Initially, all the methods described in Controller
- Migrate to Model
- Methodize common logic (latest version)
** Around drawing of View **
- I was rendering the script tag in the HTML partial template
- Migrate to js file (link is comment_tags)
- Methodize common logic in one file (latest version)
Chart summary
It ’s also the biggest learning in this portfolio, : wave: ** You can always find the answer by moving your hand! ** ** It was a product that I was convinced of. Read the parameters that can be handled now, build logic based on them, and send the parameters if they are not enough. I think it was a very valuable learning to have gained this from my own experience.
I spent about a week digging into the console screen until I implemented all the charts at a minimum, but the moment I made the logic, the sense of accomplishment was so great that it was fun: v:
at the end
When I was researching the portfolio, I couldn't find an article with the same level of feeling as myself because it was just "This is an advantage!", And it was not the material I wanted, so I wrote it.
Of course, I think there is still room for improvement, but since there is no end to it, I think I'll break it up.
I hope it will catch the eye of those who are going to create portfolios and help inspiration even a little: ramen: I also want to see articles like this from various people, so please write them: eyes:
Thank you very much!
** See ** 73 recipes to easily create a search form with Ransack Implement multiple word search function (or) and minus search function (-) in rails chart.js codepen gem 'gon'
Recommended Posts