Unsupervised learning of mnist with variational auto encoder, clustering and evaluating the final stage
from __future__ import absolute_import
from __future__ import division
from __future__ import print_function
#Import required libraries
from keras.datasets import mnist
import numpy as np
import pandas as pd
import sklearn
#Display plot results in notebook when using Jupyter notebook
import matplotlib.pyplot as plt
%matplotlib inline

from keras.layers import Lambda, Input, Dense
from keras.models import Model
from keras.losses import mse
from keras import backend as K
import gc
Using TensorFlow backend.
feature_dims = range(2, 12)
#Read data with Keras function. Shuffle the data and split it into learning and training data
(x_train, y_train), (x_test, y_test) = mnist.load_data()

#Convert 2D data to numbers
x_train = x_train.reshape(60000, 784)
x_test = x_test.reshape(10000, 784)
#Type conversion
x_train = x_train.astype('float32')
x_test = x_test.astype('float32')
#Divide by 255 as a new variable
x_train /= 255
x_test /= 255

# one-Method for hot encoding
from keras.utils.np_utils import to_categorical
#10 classes
num_classes = 10
y_train = y_train.astype('int32')
y_test = y_test.astype('int32')
labels = y_test
# one-hot encoding
y_train = to_categorical(y_train, num_classes)
y_test =  to_categorical(y_test, num_classes)
def fitting(feature_dim, x_train, y_train, x_test, y_test):
    original_dim = x_train.shape[1]

    input_shape = (original_dim, )
    latent_dim = feature_dim

    # Reparametrization Trick
    def sampling(args):
        z_mean, z_logvar = args
        batch = K.shape(z_mean)[0]
        dim = K.int_shape(z_mean)[1]
        epsilon = K.random_normal(shape=(batch, dim), seed = 5) # ε
        return z_mean + K.exp(0.5 * z_logvar) * epsilon

    #VAE model construction
    inputs = Input(shape=input_shape)
    x1 = Dense(256, activation='relu')(inputs)
    x2 = Dense(64, activation='relu')(x1)
    z_mean = Dense(latent_dim)(x2)
    z_logvar = Dense(latent_dim)(x2)
    z = Lambda(sampling, output_shape=(latent_dim,))([z_mean, z_logvar])
    encoder = Model(inputs, [z_mean, z_logvar, z], name='encoder')
    encoder.summary()

    latent_inputs = Input(shape=(latent_dim,))
    x3 = Dense(64, activation='relu')(latent_inputs)
    x4 = Dense(256, activation='relu')(x3)
    outputs = Dense(original_dim, activation='sigmoid')(x4)
    decoder = Model(latent_inputs, outputs, name='decoder')
    decoder.summary()

    z_output = encoder(inputs)[2]
    outputs = [decoder(z_output),z_output]
    vae = Model(inputs, outputs, name='variational_autoencoder')

    #Loss function
    # Kullback-Leibler Loss
    kl_loss = 1 + z_logvar - K.square(z_mean) - K.exp(z_logvar)
    kl_loss = K.sum(kl_loss, axis=-1)
    kl_loss *= -0.5
    # Reconstruction Loss
    reconstruction_loss = mse(inputs, outputs[0])
    reconstruction_loss *= original_dim

    vae_loss = K.mean(reconstruction_loss + kl_loss)
    vae.add_loss(vae_loss)
    vae.compile(optimizer='adam')
    vae.summary()
    history = vae.fit(x_train,
                    epochs=50,
                    batch_size=256,
                    validation_data=(x_test, None))
    result = vae.predict(x_test)

    K.clear_session() #← This is
    gc.collect()
    from IPython.display import clear_output
    clear_output()
    return (history, vae, result)
#model = fitting(10, x_train, y_train, x_test, y_test)
models = [None] * len(feature_dims)
histories = [None] * len(feature_dims)
dec_imgs = [None] * len(feature_dims)
results = [None] * len(feature_dims)
for i in range(len(feature_dims)):
    (histories[i], models[i], dec_imgs[i]) = fitting(feature_dims[i], x_train, y_train, x_test, y_test)
for i in range(len(feature_dims)):
    print(feature_dims[i])
    result = dec_imgs[i]
    decoded_imgs = result[0]
    #Display of test image and converted image
    n = 10
    plt.figure(figsize=(10, 2))
    for j in range(n):
        #Display test image
        ax = plt.subplot(2, n, j+1)
        plt.imshow(x_test[i].reshape(28, 28))
        plt.gray()
        ax.get_xaxis().set_visible(False)
        ax.get_yaxis().set_visible(False)

        #View converted image
        ax = plt.subplot(2, n, j+1+n)
        plt.imshow(decoded_imgs[i][0][j].reshape(28, 28))
        plt.gray()
        ax.get_xaxis().set_visible(False)
        ax.get_yaxis().set_visible(False)
    plt.show()
    results[i] = result[1]


for i in range(len(feature_dims)):
    results[i] = dec_imgs[i][1]
#model.save('model/mnist-10')
#model = keras.models.load_model('model/mnist-10')
#for i in range(len(feature_dims)):
#    models[i].pop() #Remove the softmax layer in the final stage and use the feature layer as the final stage.
#    models[i].summary()
#result = model.predict(x_test)
#results = [None] * len(feature_dims)
#for i in range(len(feature_dims)):
#    keras.backend.clear_session()
#    results[i] = models[i].predict(x_test)
def tsne(result):
    #t-Dimensionality reduction with SNE
    from sklearn.manifold import TSNE
    tsne = TSNE(n_components=2, random_state = 0, perplexity = 30, n_iter = 1000)
    return tsne.fit_transform(result)
#tsne = tsne(result)
tsnes = [None] * len(feature_dims)
for i in range(len(feature_dims)):
    tsnes[i] = tsne(results[i])
#df = pd.DataFrame(tsne, columns = ['x', 'y'])
#df['label'] = labels
def km(n_clusters, result):
    # k-Cluster by means
    from sklearn.cluster import KMeans
    return KMeans(n_clusters).fit_predict(result)
#km = km(10, result)
#df['km'] = km
kms = [None] * len(feature_dims)
for i in range(len(feature_dims)):
    kms[i] = km(10, results[i])
def DBSCAN(n_clusters, result):
    from sklearn.cluster import DBSCAN
    db = DBSCAN(eps=0.2, min_samples=n_clusters).fit(result)
    return db.labels_
#dbscan = DBSCAN(20, result)
#df['DBSCAN'] = dbscan
def hierarchy(result):
    from scipy.cluster.hierarchy import linkage, dendrogram
    result1 = linkage(result,
                  metric = 'braycurtis',
                  #metric = 'canberra',
                  #metric = 'chebyshev',
                  #metric = 'cityblock',
                  #metric = 'correlation',
                  #metric = 'cosine',
                  #metric = 'euclidean',
                  #metric = 'hamming',
                  #metric = 'jaccard',
                  #method= 'single')
                  method = 'average')
                  #method= 'complete')
                  #method='weighted')
    return result1
#hierarchy = hierarchy(result)
#display(hierarchy)
def label_to_colors(label):
    color_dict = dict([(color[0], color[1]['color']) for color in zip(np.unique(label), plt.rcParams['axes.prop_cycle'])])
    colors = np.empty(label.shape, np.object)
    for k, v in color_dict.items():
        colors[label==k] = v
    return colors

#def cluster_visualization(x, y, label, cluster, method, n_clusters):
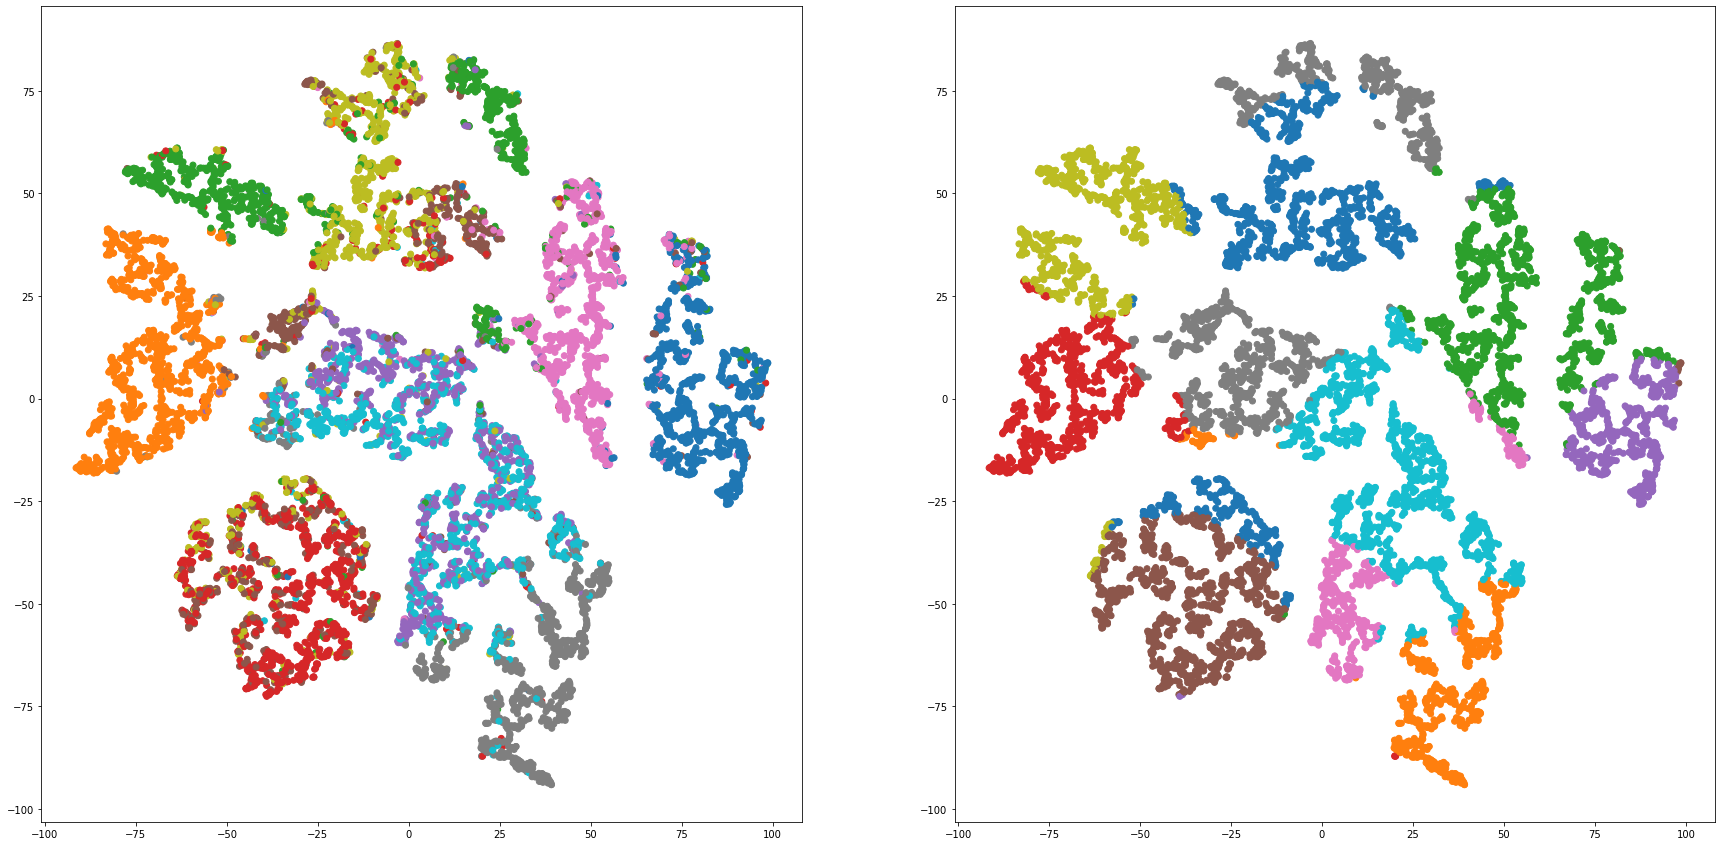
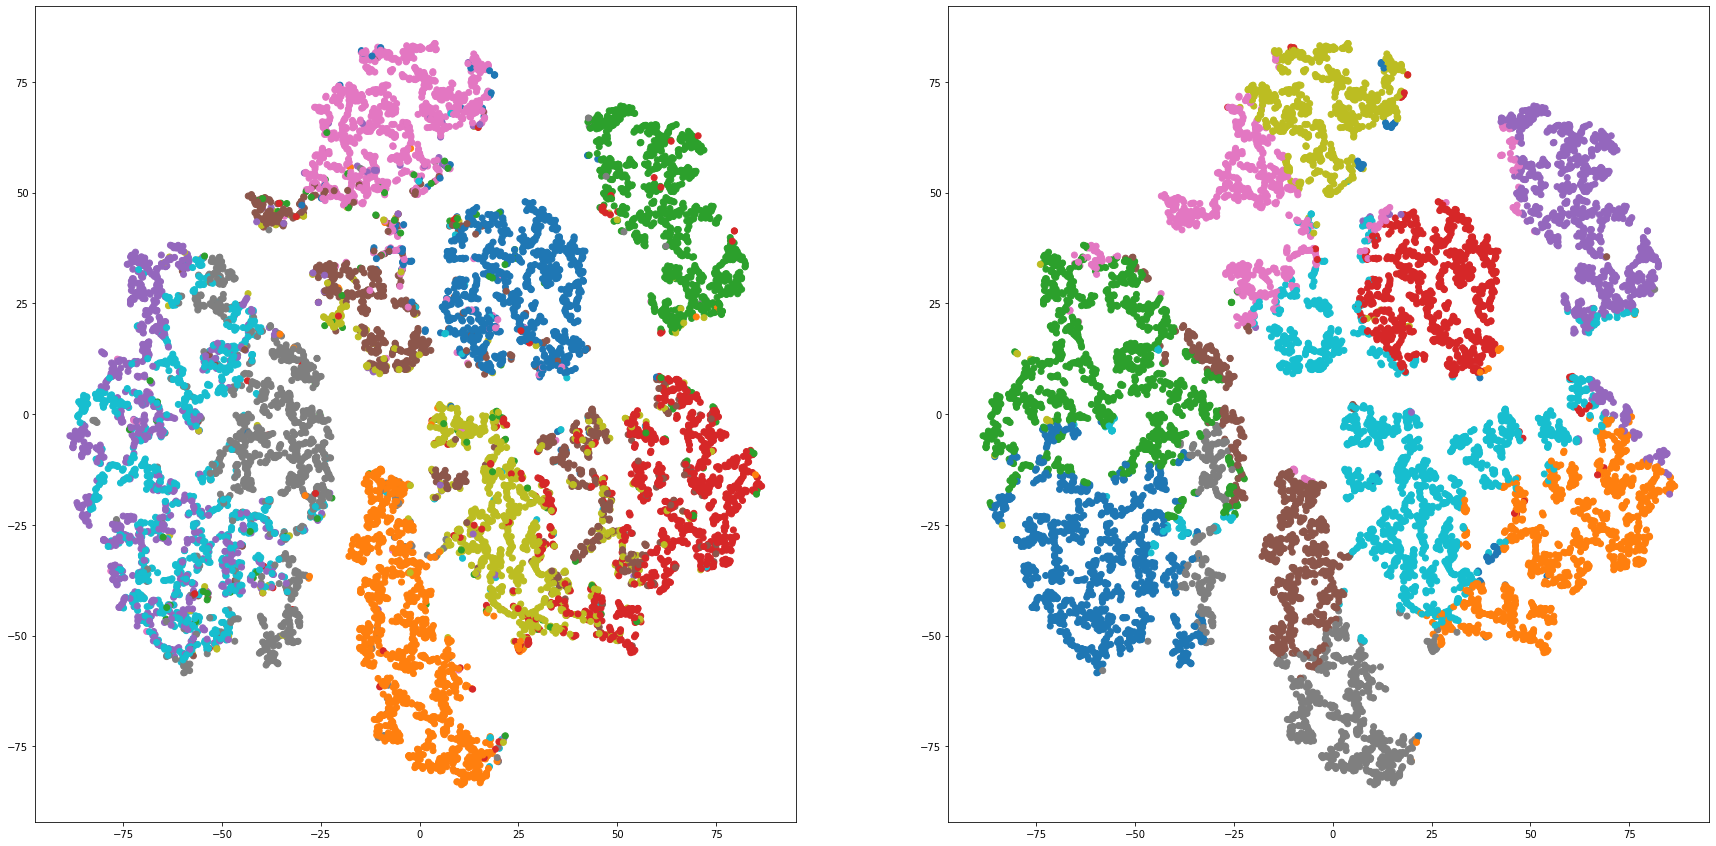
def cluster_visualization(x, y, label, cluster):
    plt.figure(figsize = (30, 15))
    plt.subplot(1,2,1)
    plt.scatter(x, y, c=label_to_colors(label))
#    for i in range(10):
#        tmp_df = df[df['label'] == i]
#        plt.scatter(tmp_df['x'], tmp_df['y'], label=i)
#    plt.legend(loc='upper left', bbox_to_anchor=(1,1))
    plt.subplot(1,2,2)
    plt.scatter(x, y, c=label_to_colors(cluster))
#    for i in range(n_clusters):
#        tmp_df = df[df[method] == i]
#        plt.scatter(tmp_df['x'], tmp_df['y'], label=i)
#    plt.legend(loc='upper left', bbox_to_anchor=(1,1))
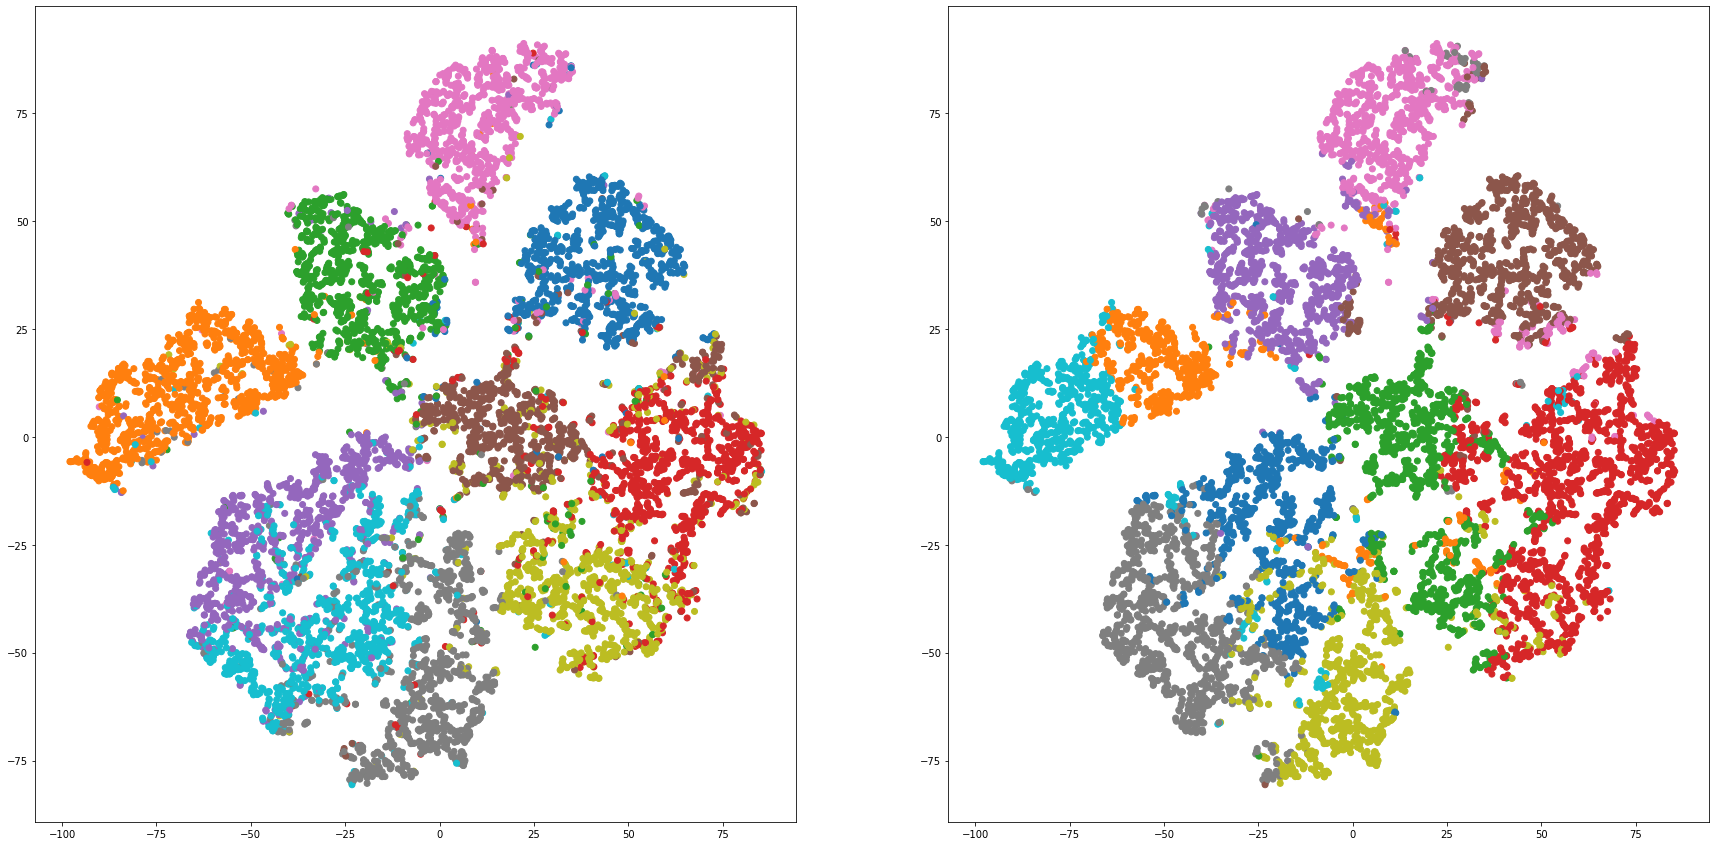
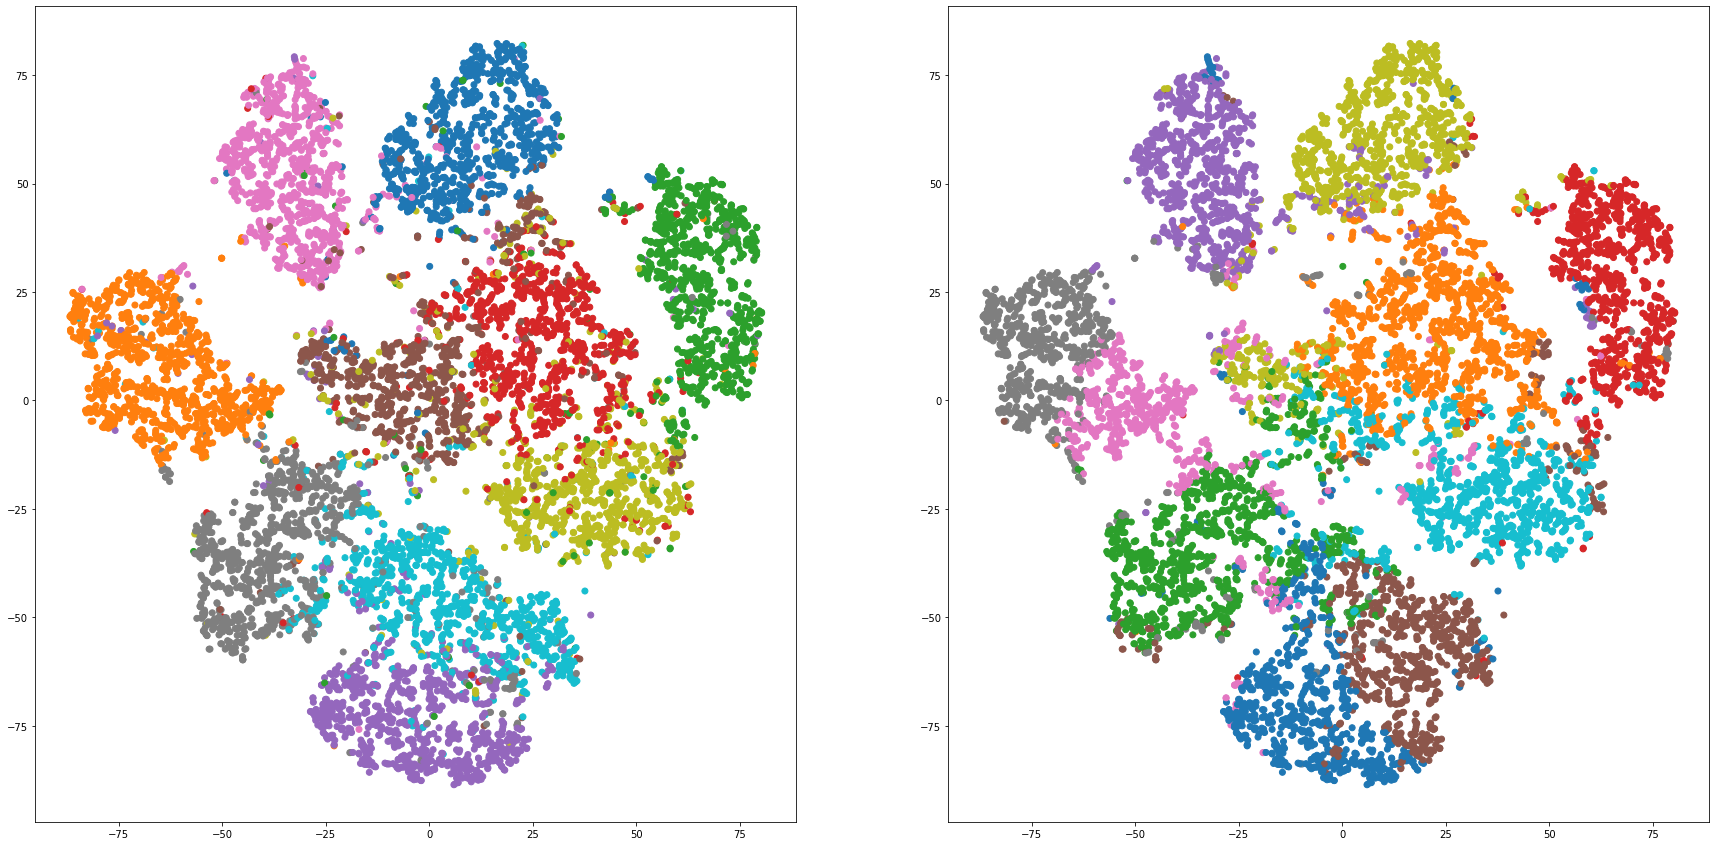
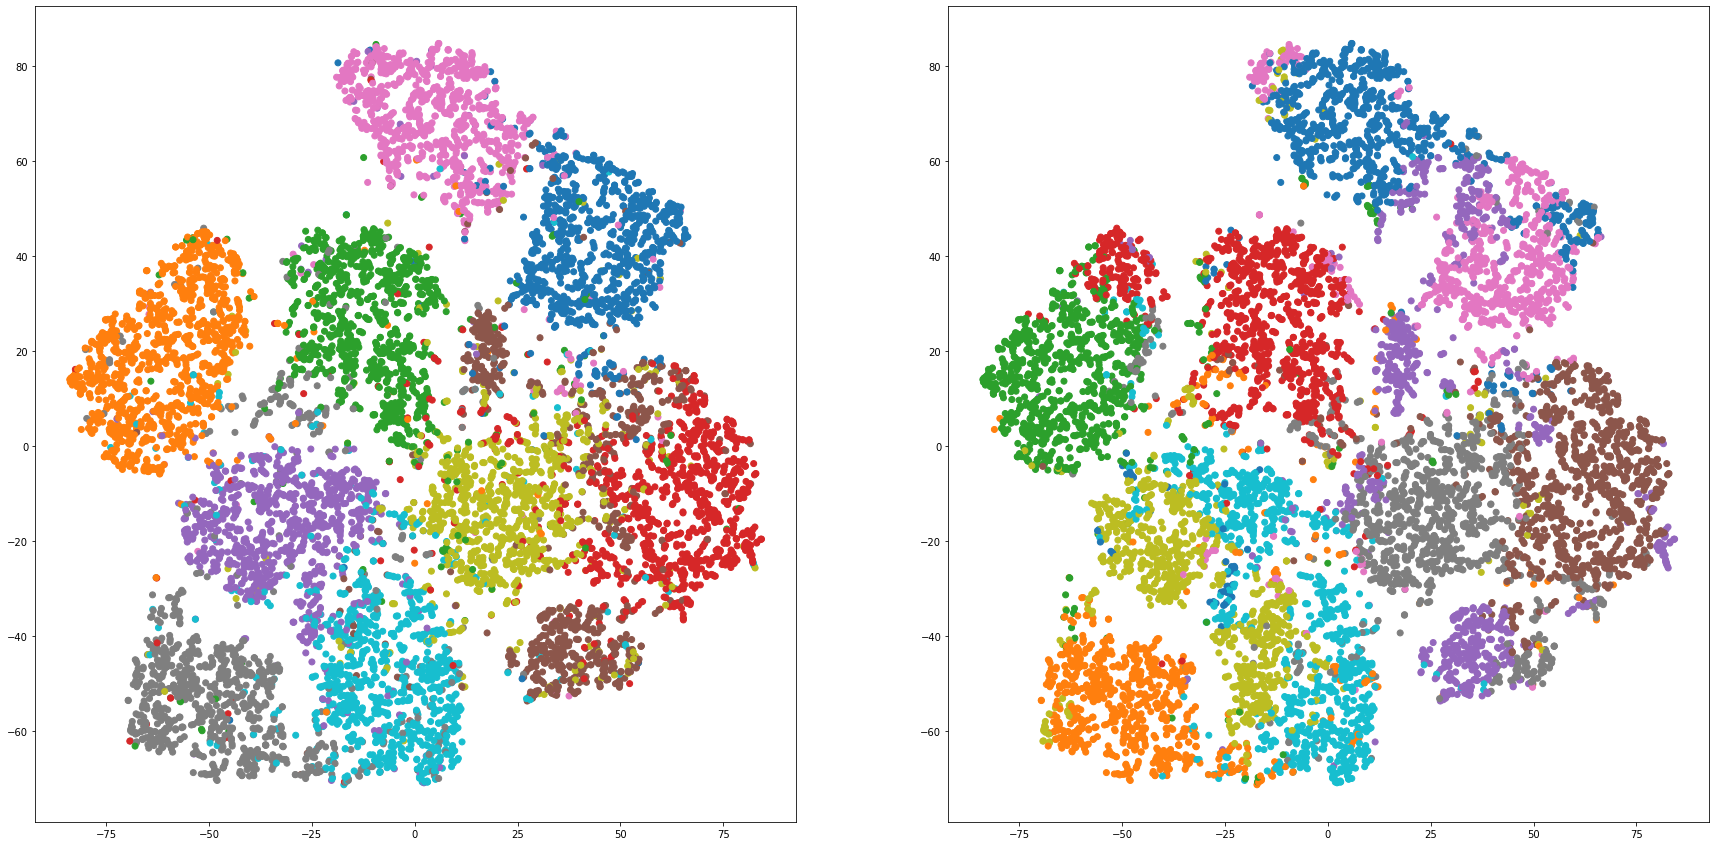
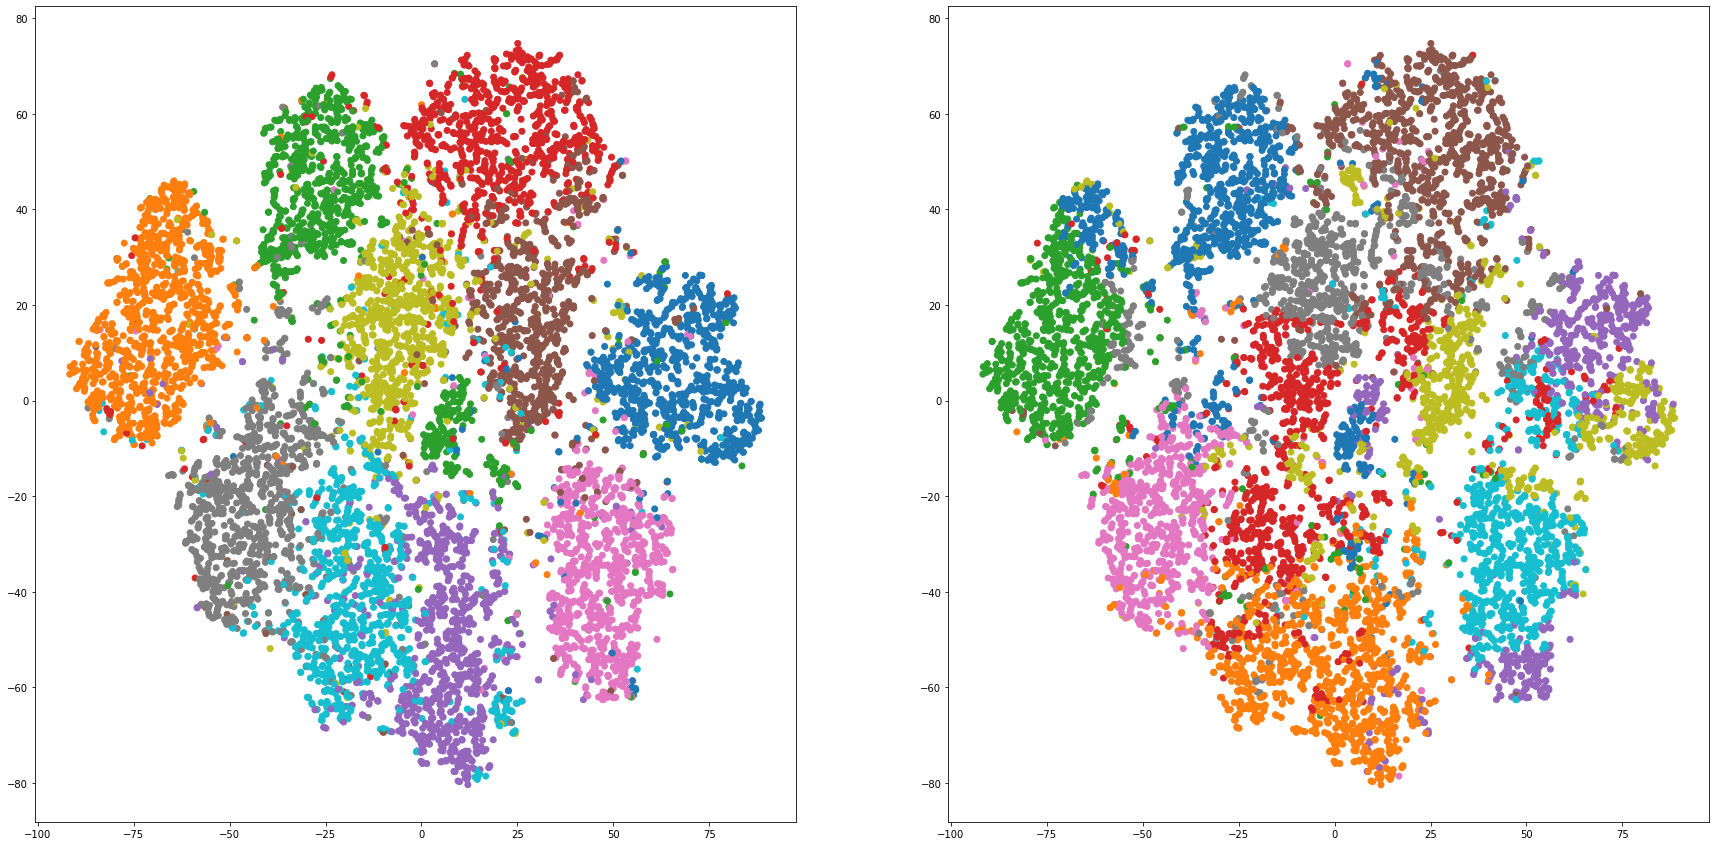
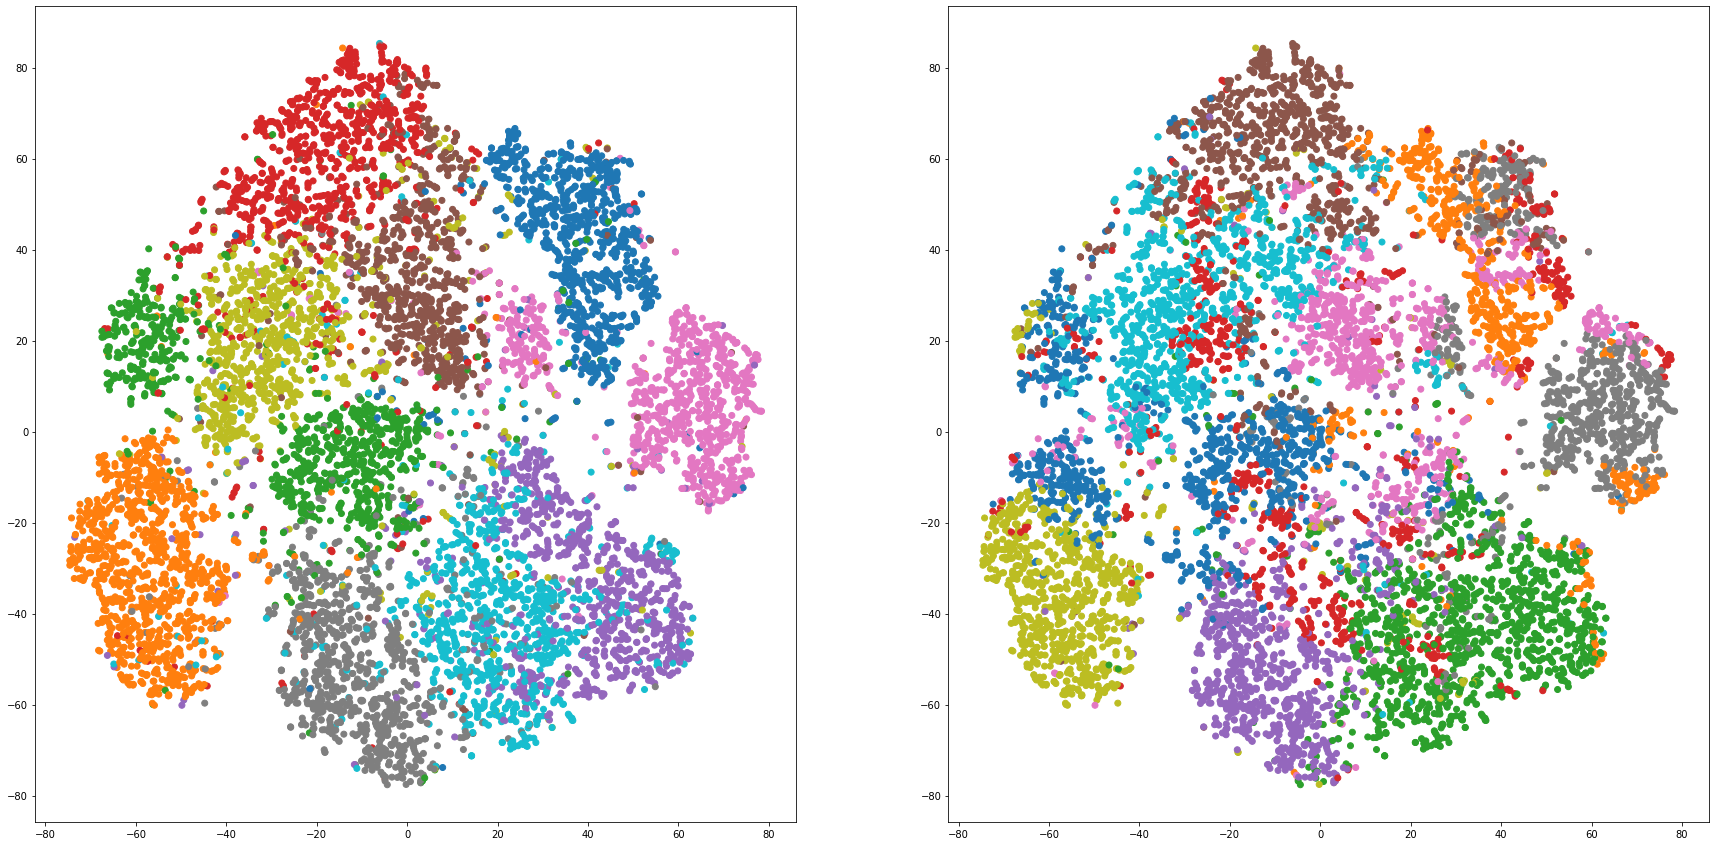
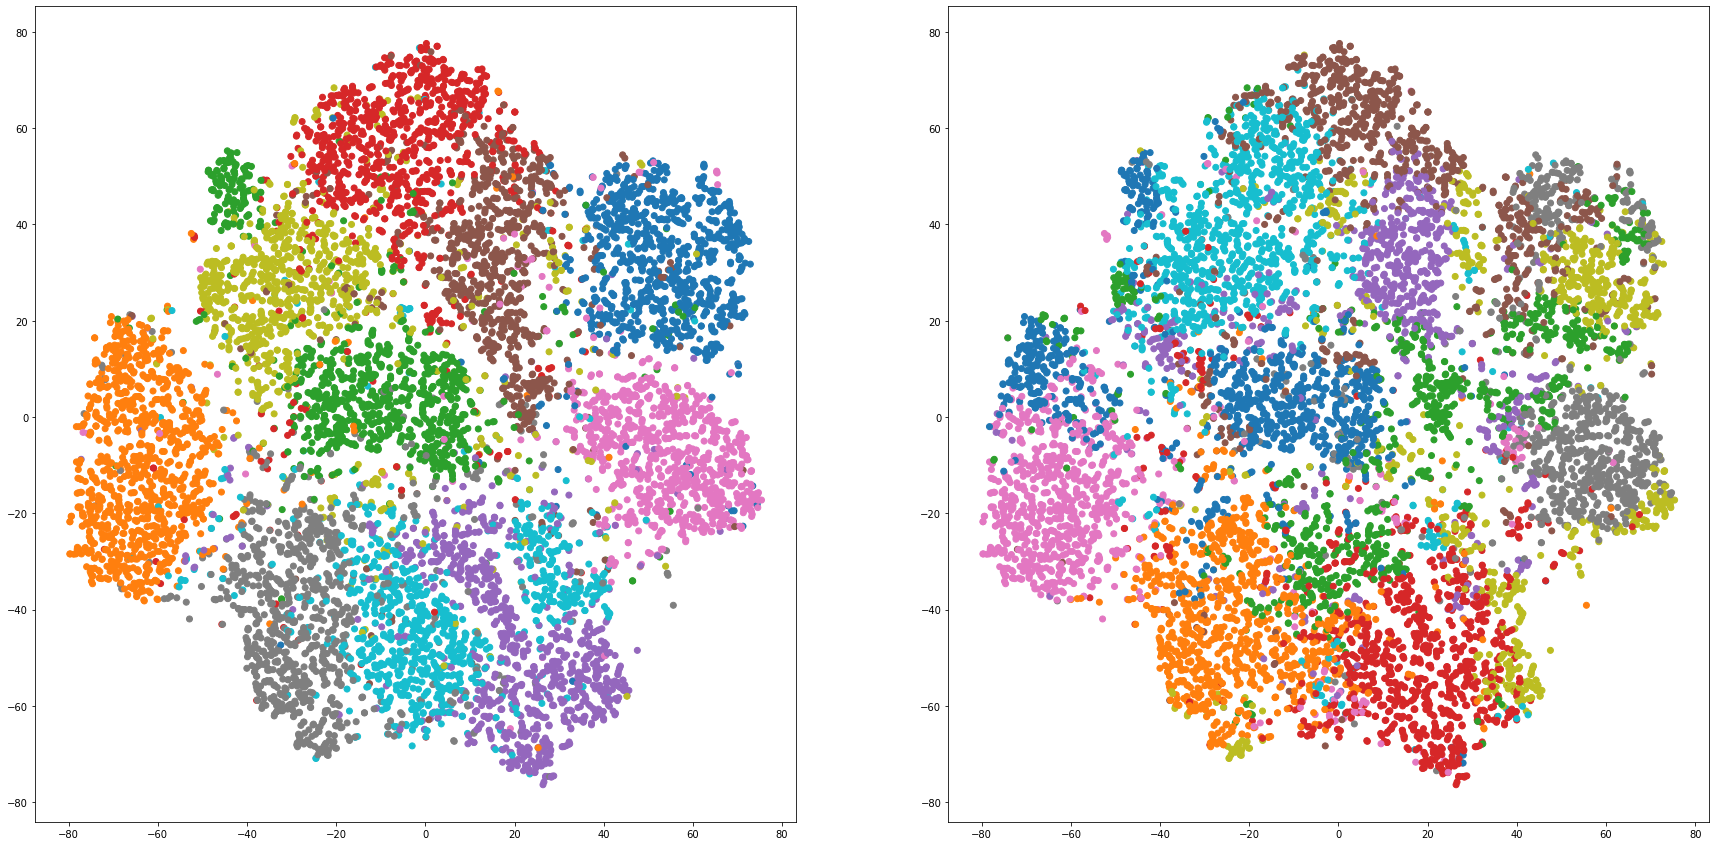
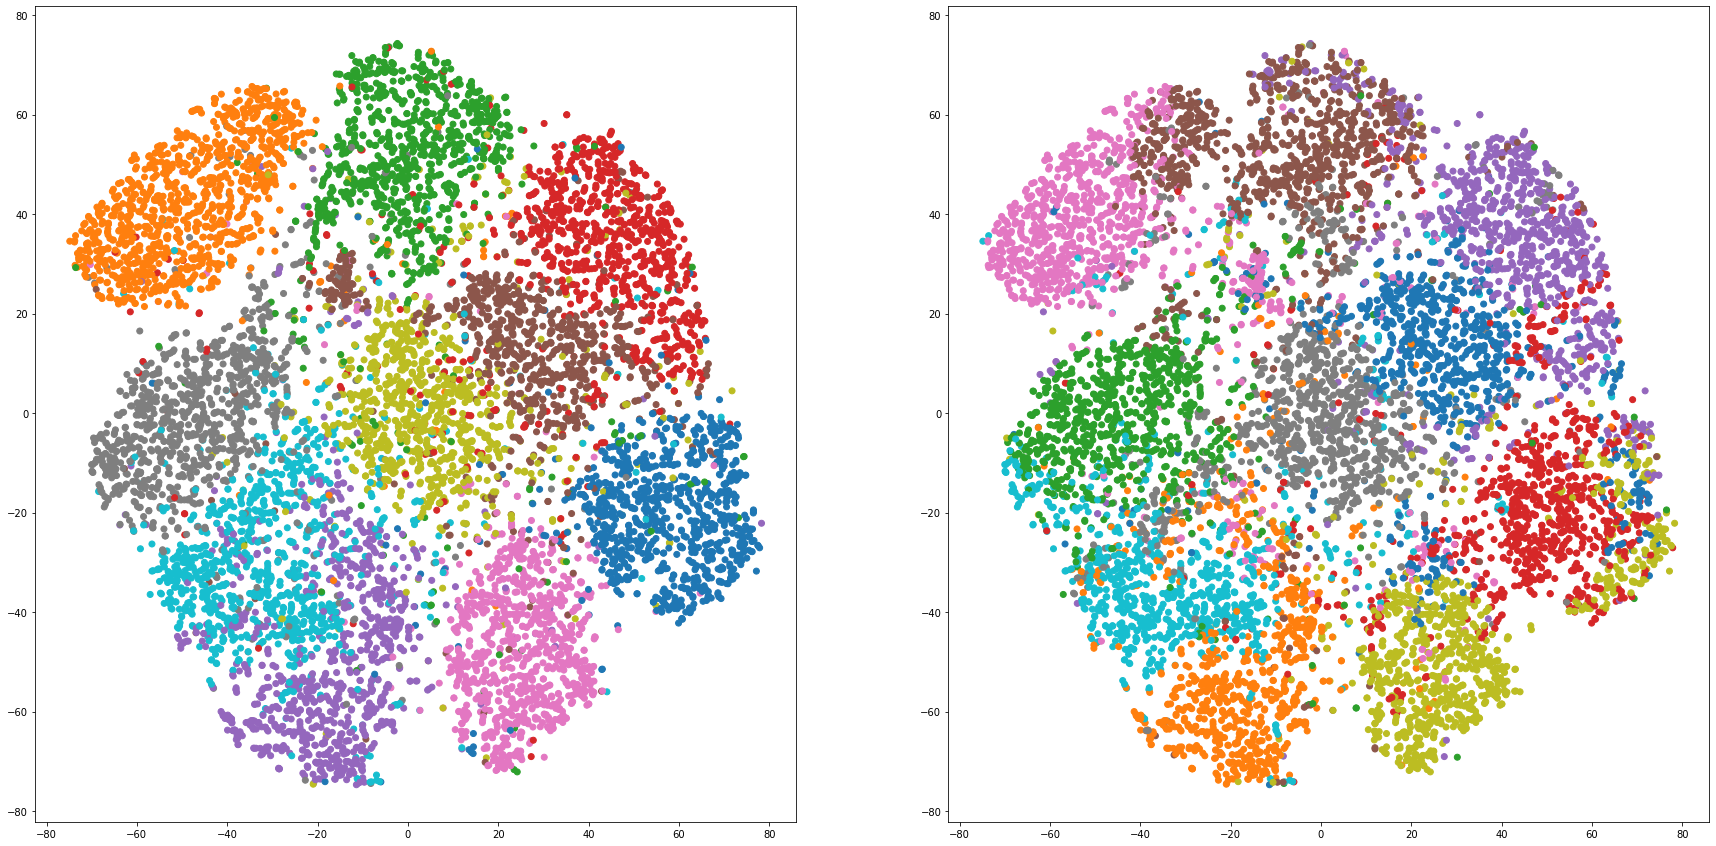
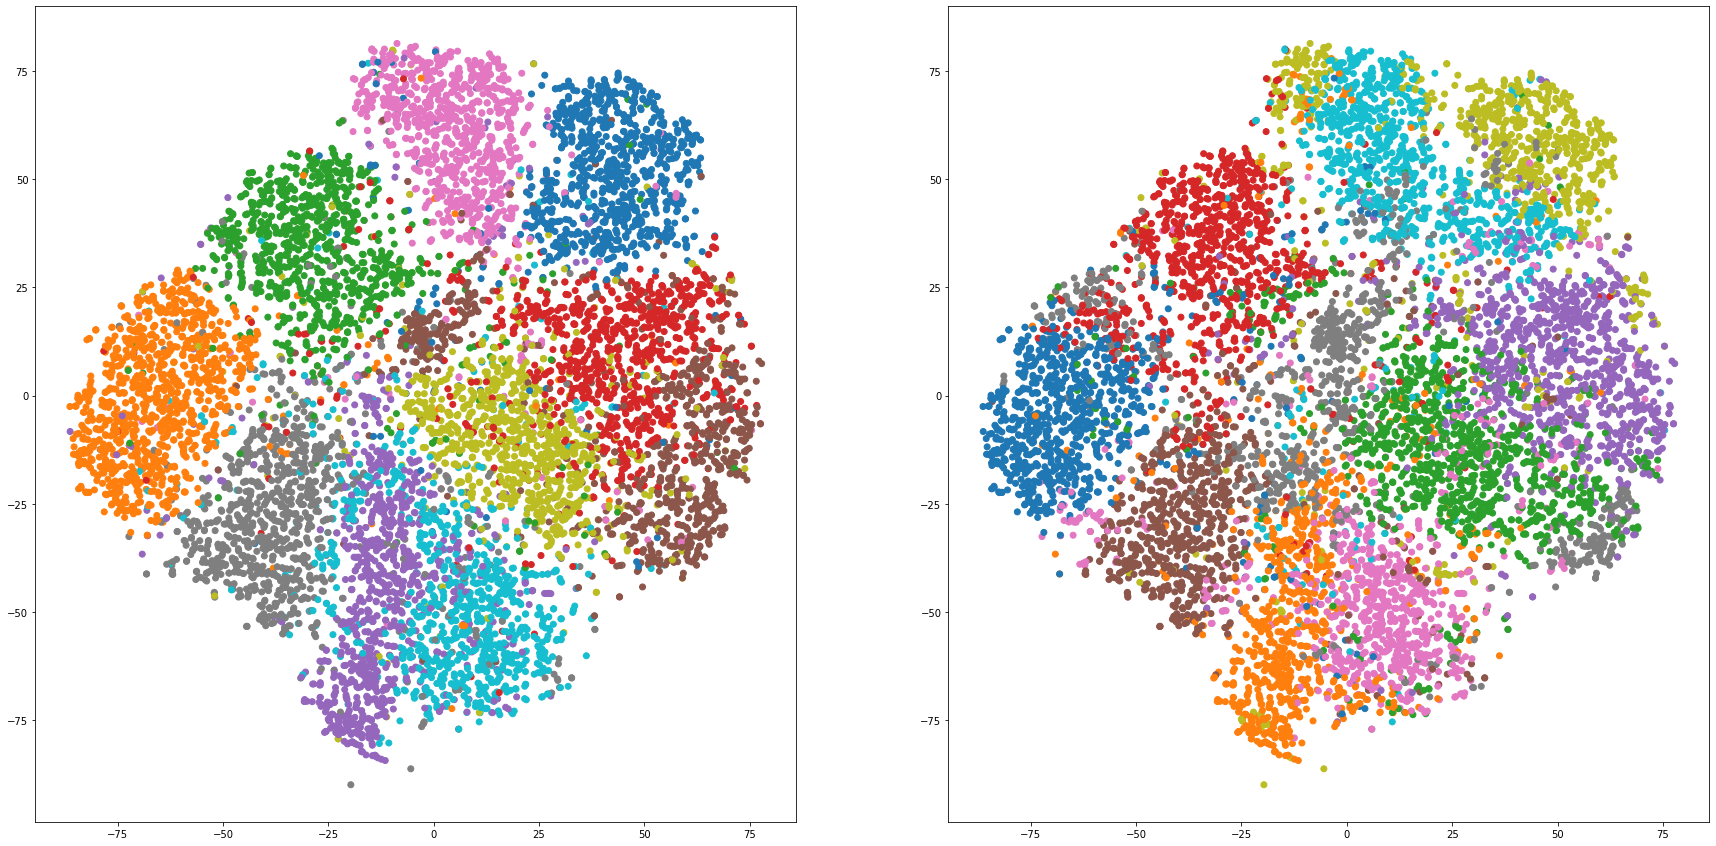
for i in range(len(feature_dims)):
    cluster_visualization(tsnes[i][:,0], tsnes[i][:,1], labels, kms[i])
# https://qiita.com/mamika311/items/75c24f6892f85593f7e7
from sklearn.metrics.cluster import adjusted_rand_score
for i in range(len(feature_dims)):
    print("dim:" + str(feature_dims[i]) + " RMI: " + str(adjusted_rand_score(labels, kms[i])))
dim:2 RMI: 0.36620498031529986
dim:3 RMI: 0.41914836520424376
dim:4 RMI: 0.49394921137719777
dim:5 RMI: 0.5245649990462847
dim:6 RMI: 0.47705674510916446
dim:7 RMI: 0.41013993209378174
dim:8 RMI: 0.3698302406743967
dim:9 RMI: 0.32840225806718926
dim:10 RMI: 0.4466812382927318
dim:11 RMI: 0.4090677997413063
# https://scikit-learn.org/stable/modules/generated/sklearn.metrics.normalized_mutual_info_score.html
# https://qiita.com/kotap15/items/38289edfe822005e1e44
from sklearn.metrics import normalized_mutual_info_score
#display(normalized_mutual_info_score(labels, df['km']))
for i in range(len(feature_dims)):
    print("dim:" + str(feature_dims[i]) + " NMI: " + str(normalized_mutual_info_score(labels, kms[i])))
dim:2 NMI: 0.5199419992579754
dim:3 NMI: 0.56100353575167
dim:4 NMI: 0.605060303081276
dim:5 NMI: 0.6020900415664949
dim:6 NMI: 0.5631744057166579
dim:7 NMI: 0.5014462787979749
dim:8 NMI: 0.46110014862882315
dim:9 NMI: 0.42836636346088663
dim:10 NMI: 0.5187118150024308
dim:11 NMI: 0.48519256224162205
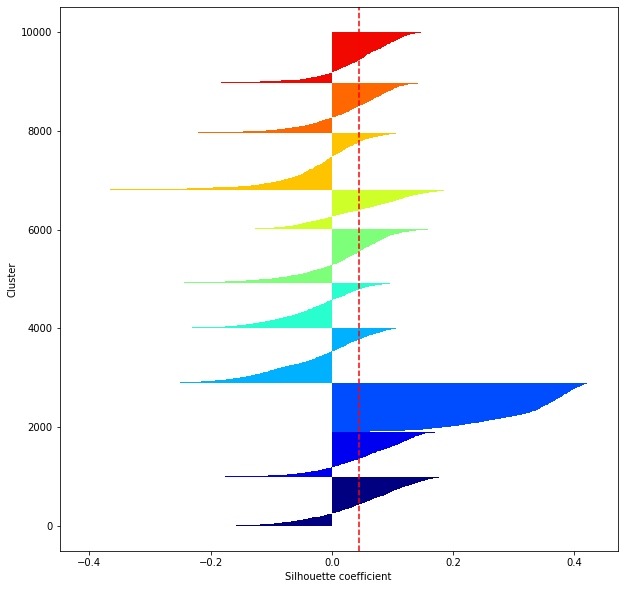
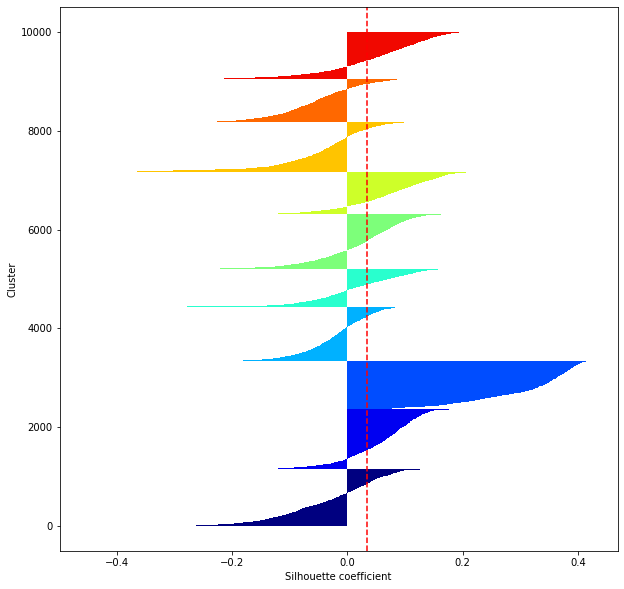
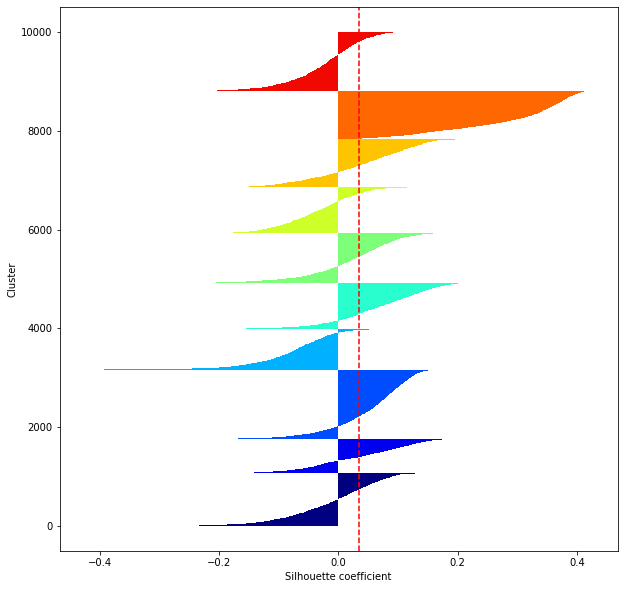
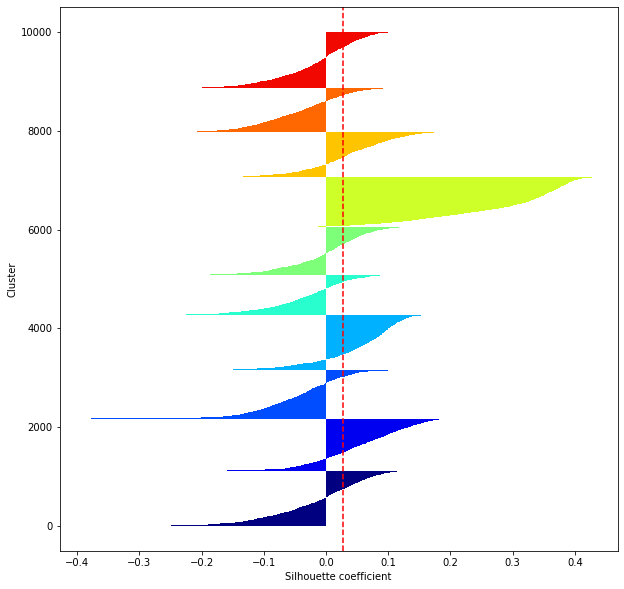
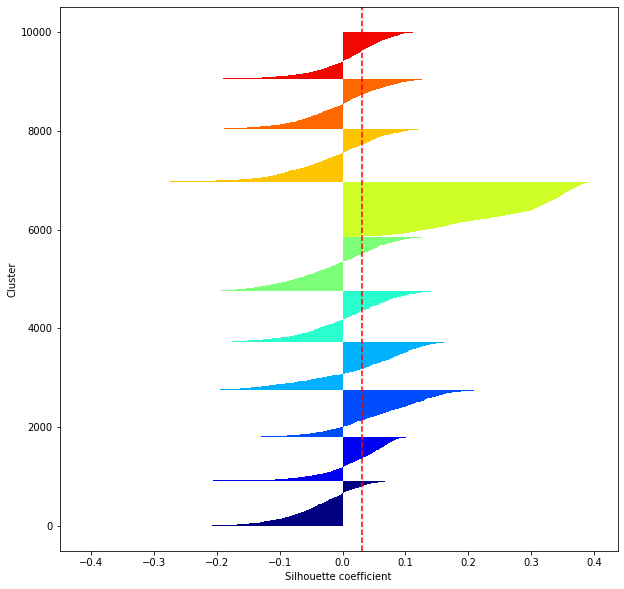
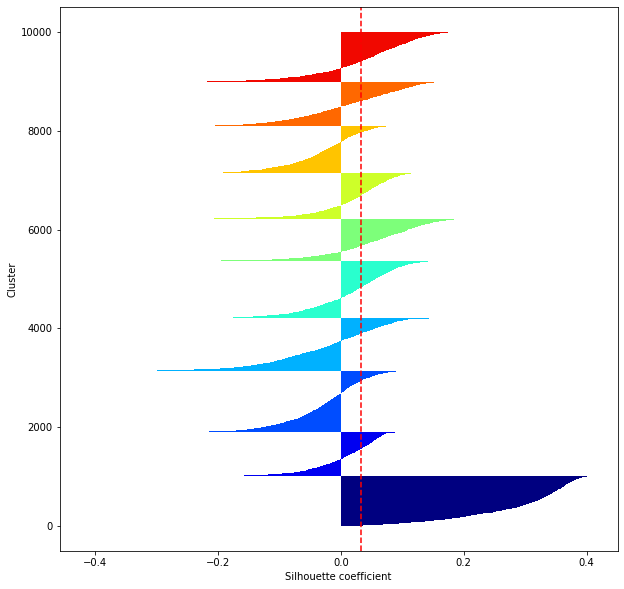
def shilhouette(clusters, x_test):
    from sklearn.metrics import silhouette_samples
    from matplotlib import cm
    plt.figure(figsize = (10, 10))
    cluster_labels=np.unique(clusters)
    n_clusters=cluster_labels.shape[0]
    silhouette_vals=silhouette_samples(x_test,clusters,metric='euclidean')
    y_ax_lower,y_ax_upper=0,0
    yticks=[]
    for i,c in enumerate(cluster_labels):
        c_silhouette_vals=silhouette_vals[clusters==c]
        print(len(c_silhouette_vals))
        c_silhouette_vals.sort()
        y_ax_upper +=len(c_silhouette_vals)
        color=cm.jet(float(i)/n_clusters)
        plt.barh(range(y_ax_lower,y_ax_upper),
                c_silhouette_vals,
                height=1.0,
                edgecolor='none',
                color=color
                )
        yticks.append((y_ax_lower+y_ax_upper)/2.)
        y_ax_lower += len(c_silhouette_vals)

    #If the silhouette coefficient is 1, clustering is good.
    #Also, when the width of the silhouette is equal on average in terms of the number of clusters, it indicates that the entire data can be divided equally.
    #This division width=A possible setting method is to optimize k so that the widths of the silhouette bars are equal and the silhouette coefficient approaches 1..

    #Draw a line at the average position
    silhouette_avg=np.mean(silhouette_vals)
    plt.axvline(silhouette_avg,color="red",linestyle="--")
    plt.ylabel("Cluster")
    plt.xlabel("Silhouette coefficient")
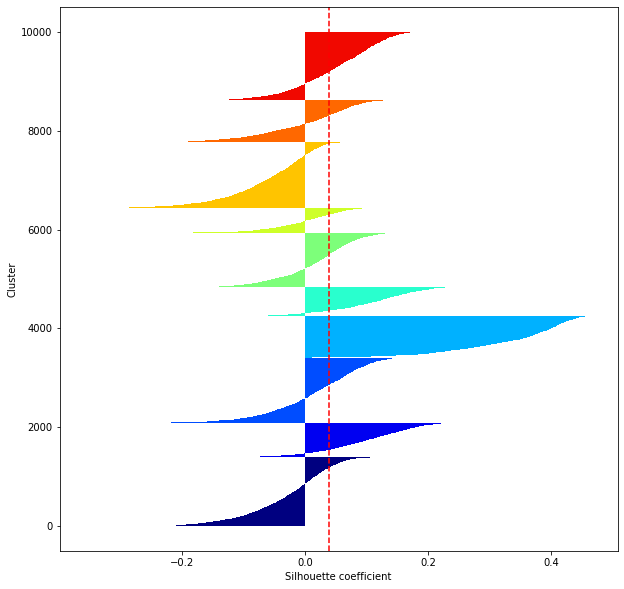
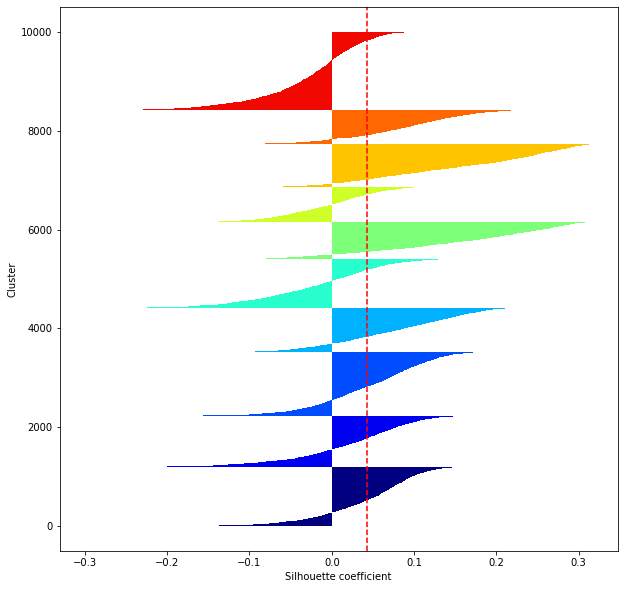
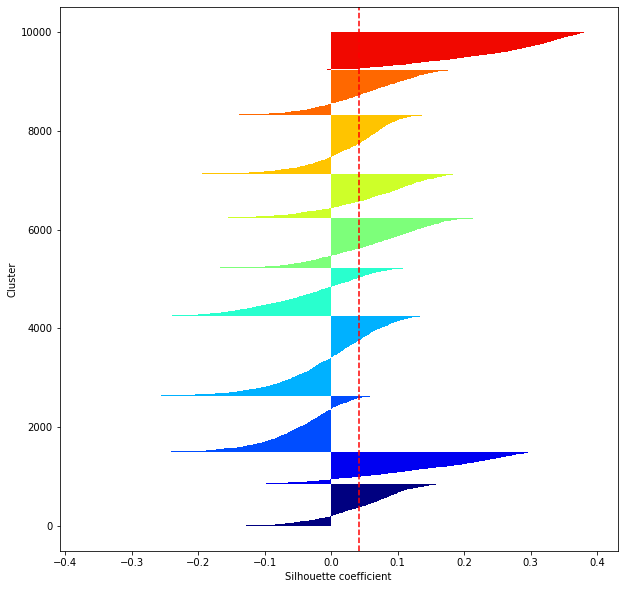
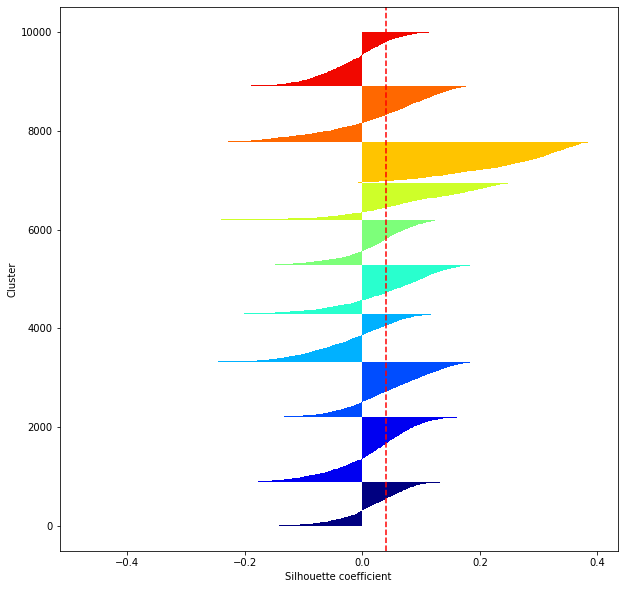
for i in range(len(feature_dims)):
    shilhouette(kms[i], x_test)
1391
704
1316
843
582
1102
500
1330
848
1384
1196
1035
1287
901
976
751
718
859
695
1582
852
657
1130
1615
977
994
904
1186
914
771
883
1316
1130
964
982
928
737
829
1140
1091
997
898
1000
1122
911
1078
803
1152
998
1041
1149
1211
976
1106
765
1100
852
1010
886
945
1070
696
1395
825
934
1008
926
969
981
1196
1117
1060
975
1118
807
970
1007
922
881
1143
921
878
948
971
1033
1098
1109
1077
1013
952
1008
888
1248
1059
1166
848
925
961
889
1008
