behavior of matplotlib: histogram normed
Histogram with matplotlib
A note of what I was addicted to when creating a histogram with matplotlib
pitfalls of normed
Note that matplotlib.axes.Axes.hist () or matplotlib.pyplot.hist (), which is used to create histograms with matplotlib, has a terrifying pitfall. When creating a histogram, we often add the option normed = 1 to normalize the frequency. However, despite this option, the histogram may look like the one below.
import numpy as np
import matplotlib.pyplot as plt
np.random.seed(0)
nor = np.random.normal(0,0.5,1000)
plt.hist(nor,normed=1,range=(-3,3),bins=300)
plt.savefig("test.pdf")
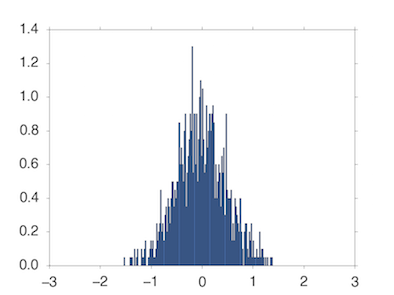
Eh, the y-axis scale value is greater than 1. ..
At first, I thought this was a bug and tried to force a histogram using barplot. But it's too much trouble. I thought it was a seaborn distroplot, but it didn't work because I had the same problem. When I thought it was a mystery, I realized that there was one.
import numpy as np
import matplotlib.pyplot as plt
np.random.seed(0)
nor = np.random.normal(0,0.5,1000)
plt.hist(nor,normed=1,range=(-3,3),bins=6)
plt.savefig("test.pdf")
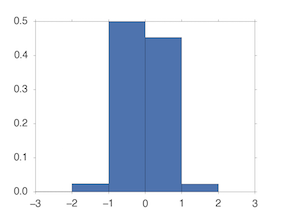
If the width of __bin is 1, it works normally. __ __ No way __ ,, How, __bin is normalized so that the total area of __bin is 1. Actually, if you look at the details of the data using numpy's histogram function (the behavior is the same as matplotlib's histogram)
import numpy as np
np.random.seed(0)
nor = np.random.normal(0,0.5,1000)
hist,pos = np.histogram(nor,normed=1,range=(-3,3),bins=300)
print(np.sum(hist))
#50.0
print(np.sum(hist)*6.0/300)
#1.0
Will be. Therefore, you can rewrite the code as follows.
import numpy as np
import matplotlib.pyplot as plt
np.random.seed(0)
nor = np.random.normal(0,0.5,1000)
binnum = 300
fig = plt.figure()
ax = plt.subplot(111)
ax.hist(nor,normed=1,range=(-3,3),bins=binnum)
ax_yticklocs = ax.yaxis.get_ticklocs()#Get scale information
ax_yticklocs = list(map(lambda x: x * len(range(-3,3))*1.0/binnum, ax_yticklocs))#Multiply the value of the original scale by the width of bin
ax.yaxis.set_ticklabels(list(map(lambda x: "%0.2f" % x, ax_yticklocs)))Show fixed scale
plt.savefig("test.pdf")

You should probably have the scale you want. However, this implementation is confusing ...
Recommended Posts