[JAVA] Examine the boundaries of the "32GB memory wall" in Elasticsearch
Introduction
Elasticsearch has long talked about the existence of a "32GB wall" in setting the JVM heap memory size. The default setting is 1g for both Xms and Xmx, but this parameter needs to be sized appropriately according to the amount of memory installed in the node.
In the Elasticsearch 2.x era, set the JVM heap size in the Elasticsearch Definitive Guide. It was mentioned as a performance tip that it does not exceed 32GB. The current official document also recommends that this size should not exceed "about" 32GB. It has been.
This article summarizes how to find this exact threshold memory size in an environment. Note that this content varies depending on the OS version and JDK version, so be sure to actually perform the following steps to check the exact size in your environment.
What is a "32GB wall" (roughly)
First and foremost, this isn't just about Elasticsearch. This is a story that applies to all JVM applications. Roughly speaking, the "32GB wall" mentioned here is related to the function that saves system resources by compressing the representation method of the reference pointer of the object stored in the Java heap in a 64-bit system. There is.
There is a detailed explanation on the following site (* 1), but normally the Java heap address on a 64-bit system is used for 64 bits, but only if the heap size is 32 GB or less, it is as follows. It is a trick to save well with 32bit address by keeping it in the constraint.
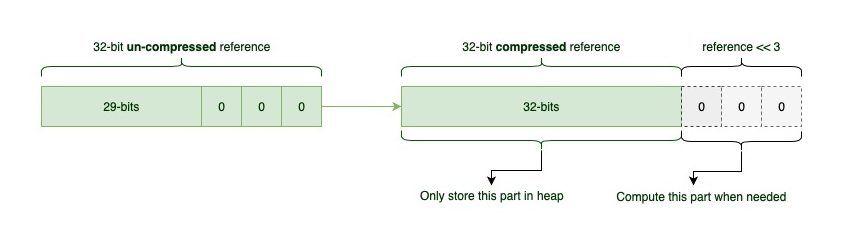
--Limit the address of the heap object to a multiple of 8 (called Object Alignment) --The address is expressed in 32 bits, and the actual address is the value obtained by multiplying that value by 8 (0x1000).
By doing this, it is possible to express an address of 35bit (= 2 ^ 35 ≒ 32GB), which was previously only possible to express 4GB (= 2 ^ 32) with 32bit. This mechanism is called "Compressed OOPs" (see Compressed Objects).
*1: https://www.baeldung.com/jvm-compressed-oops
Of course, this method cannot be used when handling heap memory of 32GB or more, so it will be a normal object reference using 64bit. In this case, the memory usage efficiency is lower than when using Compressed OOPs, so it is recommended not to set the heap size beyond 32GB memory.
Verification procedure
Here, using the following environment, we will explore the "boundary line" of Compressed OOPs while changing the size of the heap size. In conclusion, this boundary line changes depending on the type of GC, so we are investigating each of the two types of CMS: ConcMarkSweep) and G1GC that can be used with JDK11.
environment
I deployed a virtual machine / OS with the following specifications on Azure and installed OpenJDK and Elasticsearch.
- spec --D13-2_v2 (2vCPU / 56GBmem) * If the memory is 32GB or more, it is OK.
- OS
- Ubuntu18.04LTS
- JDK
- OpenJDK 11.0.6
- Elasticsearch
- Elasticsearch 7.6.1
Combination of GC type and heap size
We verified with the following four combinations. Note that the border heap size is slightly different between 01,02 and 03,04. (30MB different) Also, if the size exceeds the boundary line size for each GC such as 01 and 02, 03 and 04, Compressed OOPs cannot be used. Below is a summary of the steps to actually check it.
| no. | GC type | Heap size(Xms/Xmx) | Can Compressed Oops be used? |
|---|---|---|---|
| 01 | CMS(ConcMarkSweep) | 32766MB | Can be used |
| 02 | CMS(ConcMarkSweep) | 32767MB | Not available |
| 03 | G1GC | 32736MB | Can be used |
| 04 | G1GC | 32737MB | Not available |
Confirmation procedure (1) Confirmation with the JVM alone
First, check the JVM alone. This uses a method to check if the JVM is running with Compressed Oops by running the java command with the "-XX: + PrintFlagsFinal" option.
01: CMS GC below border (32766MB)
Notice the last line of the output below. The part where "bool Use Compressed Oops = true" is the output when Compressed Oops is enabled. In other words, the "32GB wall" is not exceeded.
sodo@vm01:~$ java -XX:+UseConcMarkSweepGC -XX:+PrintFlagsFinal -Xms32766m -Xmx32766m 2>/dev/null | grep Compressed
   size_t CompressedClassSpaceSize                 = 1073741824                                {product} {default}
     bool UseCompressedClassPointers               = true                                 {lp64_product} {ergonomic}
     bool UseCompressedOops                        = true                                 {lp64_product} {ergonomic}
02: Border over (32767MB) at CMSGC
"Bool Use CompressedOops = false", which exceeds the "32GB wall".
sodo@vm01:~$ java -XX:+UseConcMarkSweepGC -XX:+PrintFlagsFinal -Xms32767m -Xmx32767m 2>/dev/null | grep Compressed
   size_t CompressedClassSpaceSize                 = 1073741824                                {product} {default}
     bool UseCompressedClassPointers               = false                                {lp64_product} {default}
     bool UseCompressedOops                        = false                                {lp64_product} {default}
03: Below the border at G1GC (32736MB)
It says "bool UseCompressedOops = true". It does not exceed the "32GB wall".
sodo@vm01:~$ java -XX:+UseG1GC -XX:+PrintFlagsFinal -Xms32736m -Xmx32736m 2>/dev/null | grep Compressed
   size_t CompressedClassSpaceSize                 = 1073741824                                {product} {default}
     bool UseCompressedClassPointers               = true                                 {lp64_product} {ergonomic}
     bool UseCompressedOops                        = true                                 {lp64_product} {ergonomic}
04: Border over (32737MB) at G1GC
It says "bool UseCompressedOops = false". It exceeds the "32GB wall".
sodo@vm01:~$ java -XX:+UseG1GC -XX:+PrintFlagsFinal -Xms32737m -Xmx32737m 2>/dev/null | grep Compressed
   size_t CompressedClassSpaceSize                 = 1073741824                                {product} {default}
     bool UseCompressedClassPointers               = false                                {lp64_product} {default}
     bool UseCompressedOops                        = false                                {lp64_product} {default}
Confirmation procedure ② Confirmation with Elasticsearch
Next, specify the heap size in the jvm.option file with Elasticsearch and check it. The result will be logged in elasticsearch.log to see if it is in Compressed Oops mode at startup, so check that.
01: CMS GC below border (32766MB)
Make the following settings in the jvm.option file. Lines 3-7 are left at their defaults. Since we are using OpenJDK11 this time, CMS is used for GC. (GC type used for gc.log is also output)
jvm.options
-Xms32766m
-Xmx32766m

# 10-13:-XX:-UseConcMarkSweepGC
# 10-13:-XX:-UseCMSInitiatingOccupancyOnly
14-:-XX:+UseG1GC
14-:-XX:G1ReservePercent=25
14-:-XX:InitiatingHeapOccupancyPercent=30
When you start Elasticsearch with this setting, you will see the following line in the log. The "compressed ordinary object pointers [true]" at the end of the line is a sign that Compressed Oops is valid.
elasticsearch.log
[2020-03-30T07:26:14,269][INFO ][o.e.e.NodeEnvironment ] [vm01] heap size [31.9gb], compressed ordinary object pointers [true]
02: Border over (32767MB) at CMSGC
Make the following settings in the jvm.option file. Only the heap size of the 1st and 2nd lines is changed.
jvm.options
-Xms32767m
-Xmx32767m

# 10-13:-XX:-UseConcMarkSweepGC
# 10-13:-XX:-UseCMSInitiatingOccupancyOnly
14-:-XX:+UseG1GC
14-:-XX:G1ReservePercent=25
14-:-XX:InitiatingHeapOccupancyPercent=30
This time it is "compressed ordinary object pointers [false]". You can see that Compressed Oops has been disabled.
elasticsearch.log
[2020-03-30T09:43:01,828][INFO ][o.e.e.NodeEnvironment ] [vm01] heap size [31.9gb], compressed ordinary object pointers [false]
03: Below the border at G1GC (32736MB)
The GC settings are changed according to the comments in the configuration file along with the heap size. Since we are using OpenJDK11 this time, G1GC is used with this setting. (I also checked the output of gc.log)
jvm.options
-Xms32736m
-Xmx32736m

10-13:-XX:-UseConcMarkSweepGC
10-13:-XX:-UseCMSInitiatingOccupancyOnly
11-:-XX:+UseG1GC
11-:-XX:G1ReservePercent=25
11-:-XX:InitiatingHeapOccupancyPercent=30
Compressed Oops is enabled here.
elasticsearch.log
[2020-03-30T07:22:29,694][INFO ][o.e.e.NodeEnvironment ] [vm01] heap size [31.9gb], compressed ordinary object pointers [true]
04: Border over (32737MB) at G1GC
Increase the heap size by 1MB. Others have not changed.
jvm.options
-Xms32737m
-Xmx32737m

10-13:-XX:-UseConcMarkSweepGC
10-13:-XX:-UseCMSInitiatingOccupancyOnly
11-:-XX:+UseG1GC
11-:-XX:G1ReservePercent=25
11-:-XX:InitiatingHeapOccupancyPercent=30
This time Compressed Oops is disabled.
elasticsearch.log
[2020-03-30T07:23:19,486][INFO ][o.e.e.NodeEnvironment ] [vm01] heap size [31.9gb], compressed ordinary object pointers [false]
Summary
Regarding the "32GB wall" often referred to in Elasticsearch, an overview of the mechanism of Compressed Oops (see compressed objects) related to JVM in general, and the procedure to check whether Compressed Oops is enabled or disabled when starting JVM and Elasticsearch in the actual environment. I introduced it. In practice, when considering an appropriate heap size, there are some points to consider, such as the usage of Elasticsearch (full-text search center, metric sort / Aggregation center, etc.) and the cache memory used by Lucene. If you have any questions, it is recommended to ask a community site such as discuss.elastic.co, or ask an expert at a user community / study session such as Elasticsearch Tokyo User Group.
Recommended Posts