How to set up and use OMC Log Analytics --Linux version -
Log Analytics of Oracle Management Cloud is a service that can aggregate and analyze various logs such as OS, Middleware, Database, etc. in a cross-cutting manner. Here, we will introduce the setting procedure and basic analysis method for actually acquiring typical Linux logs.
--Select Log Analytics-> Log Management-> Entity from the menu icon in the upper left

--Click on New Association

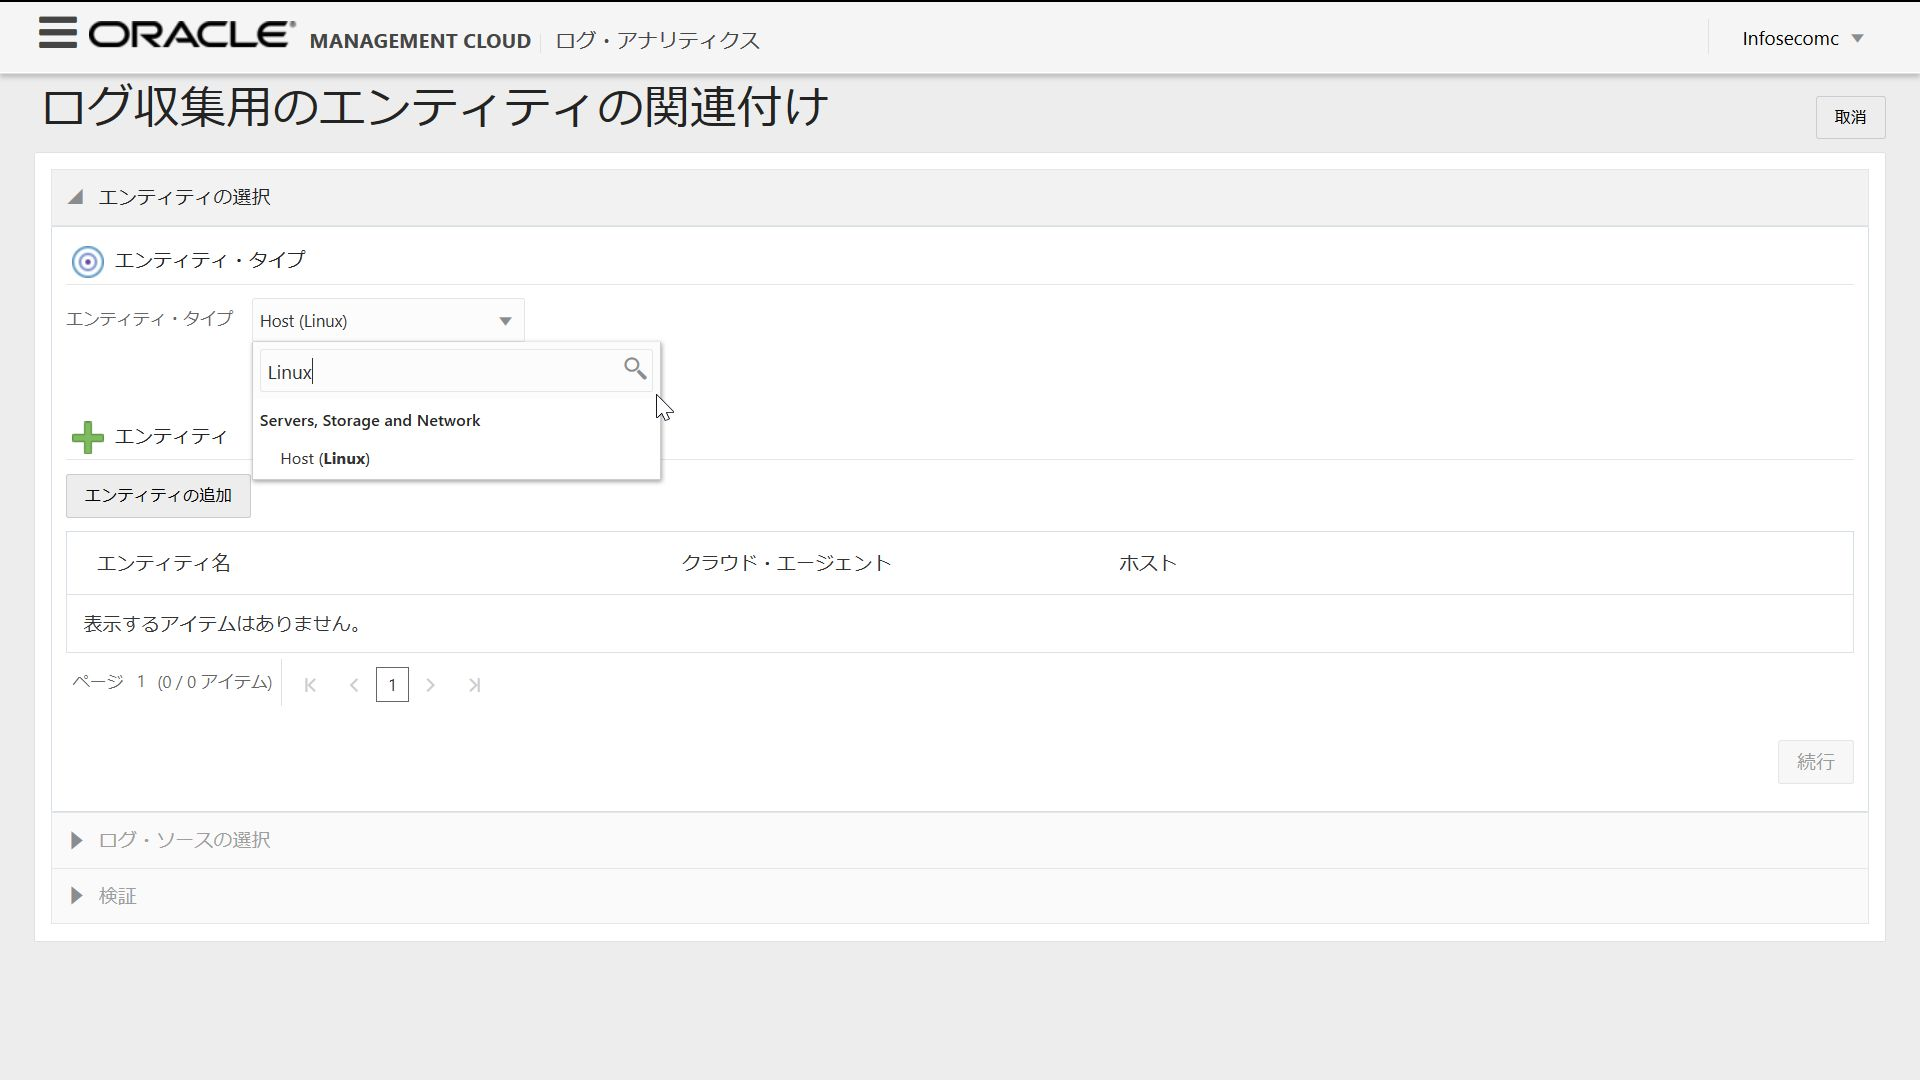
--Select the entity type as Host (Linux) and click Add Entity
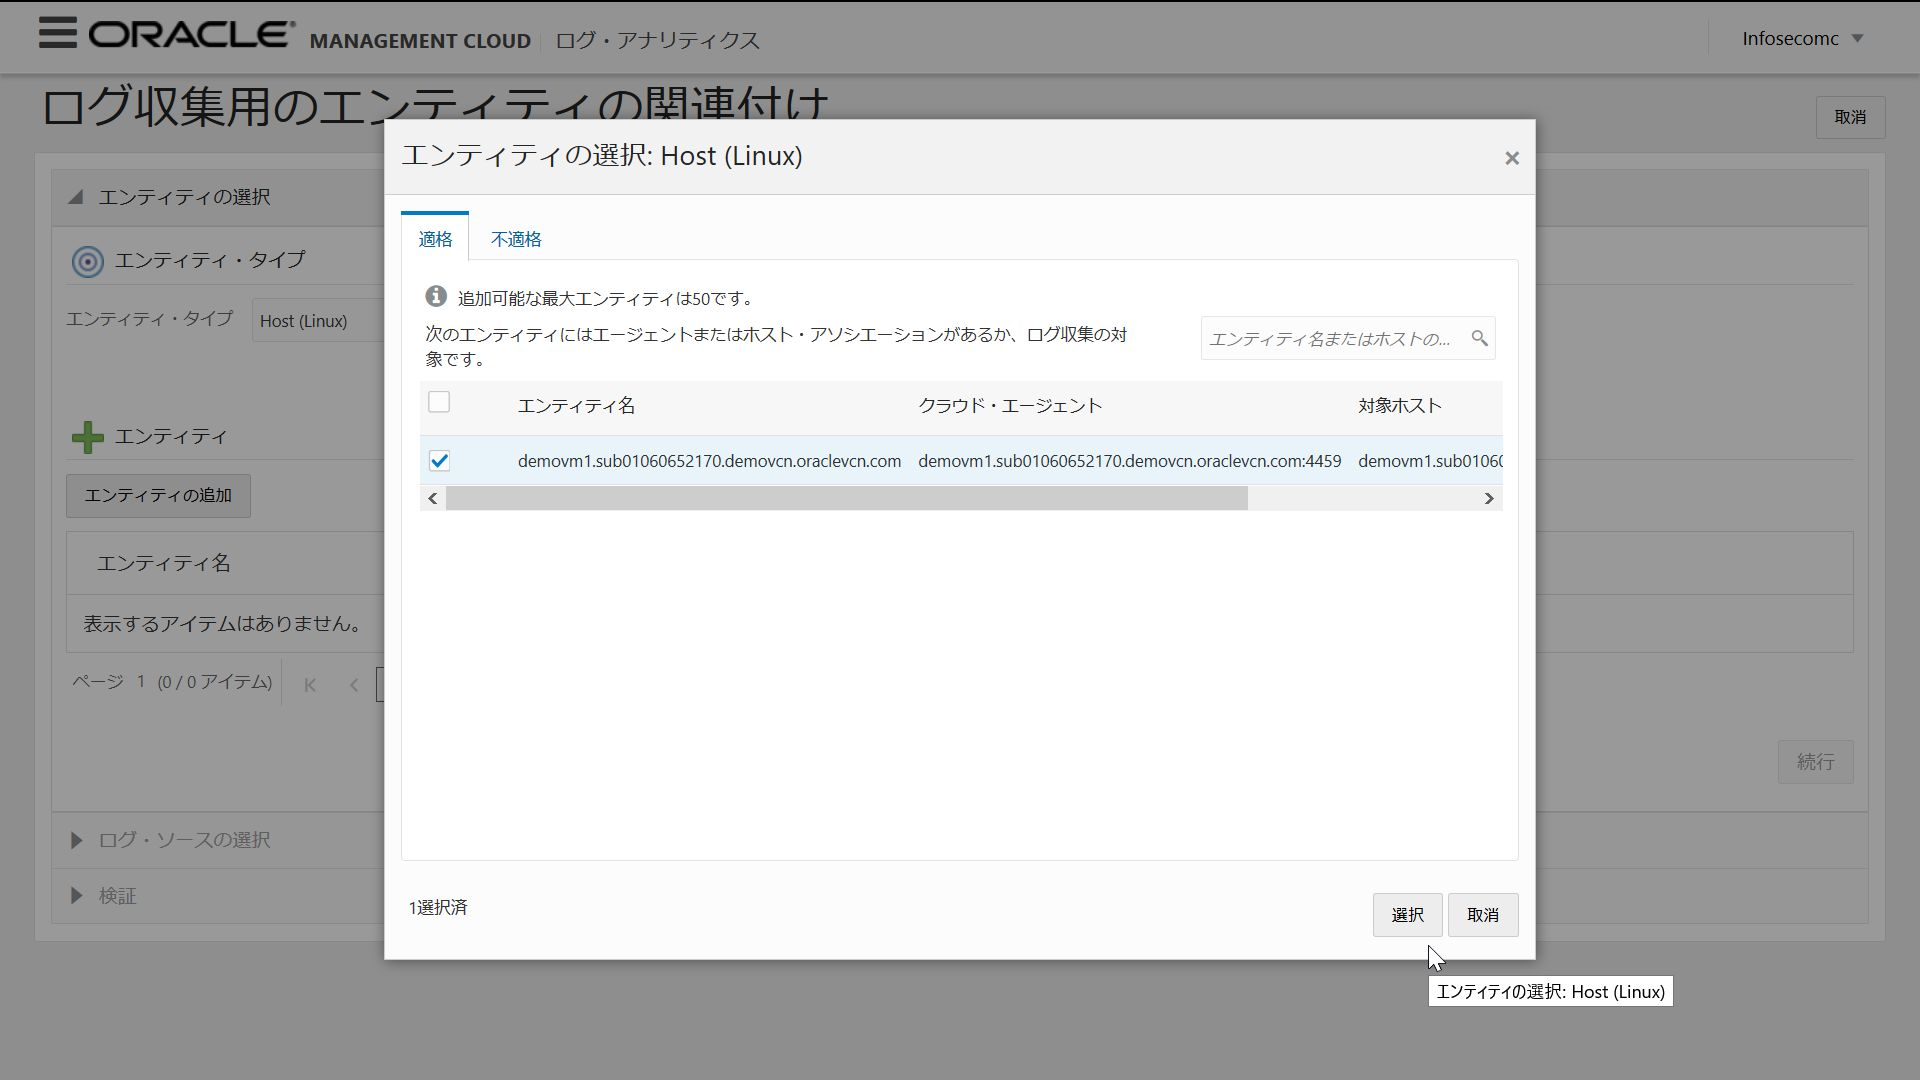
--Host registered as an entity can be selected, so check it and click Select
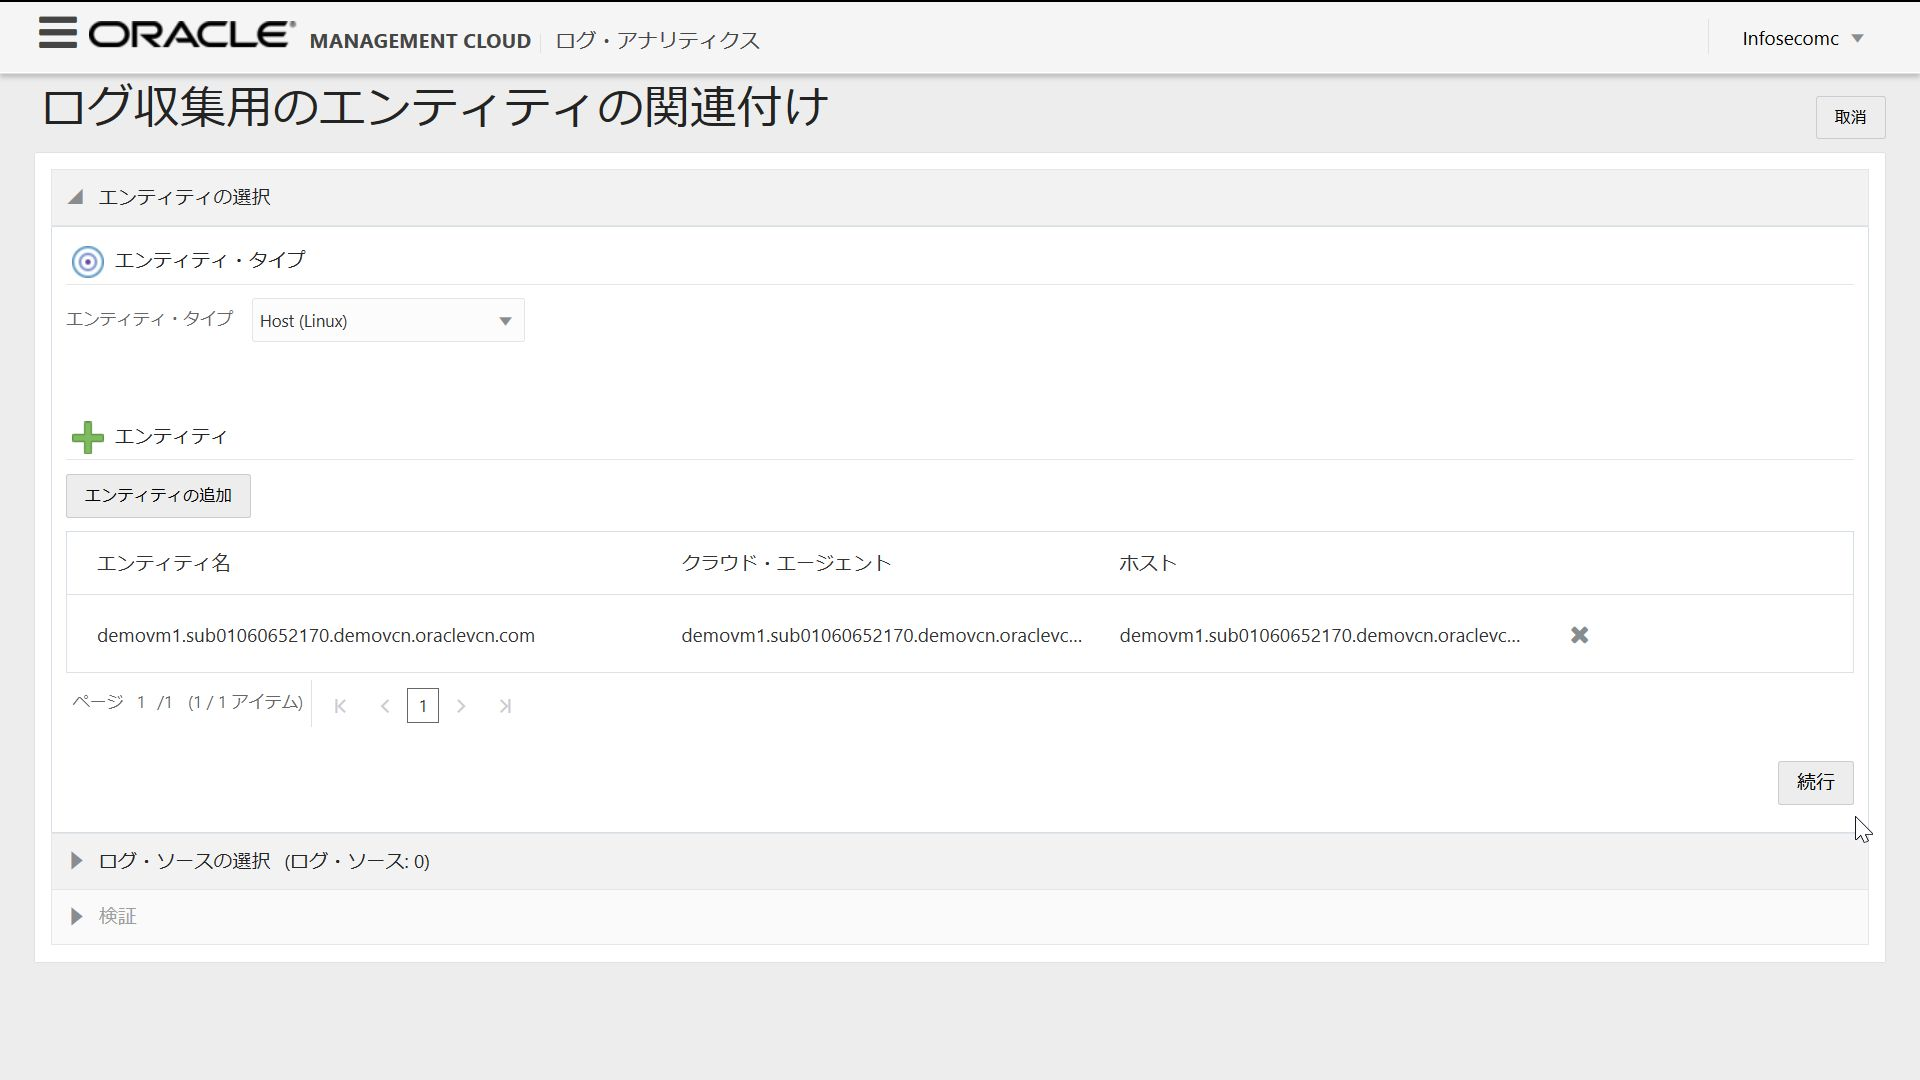
--Choose to continue
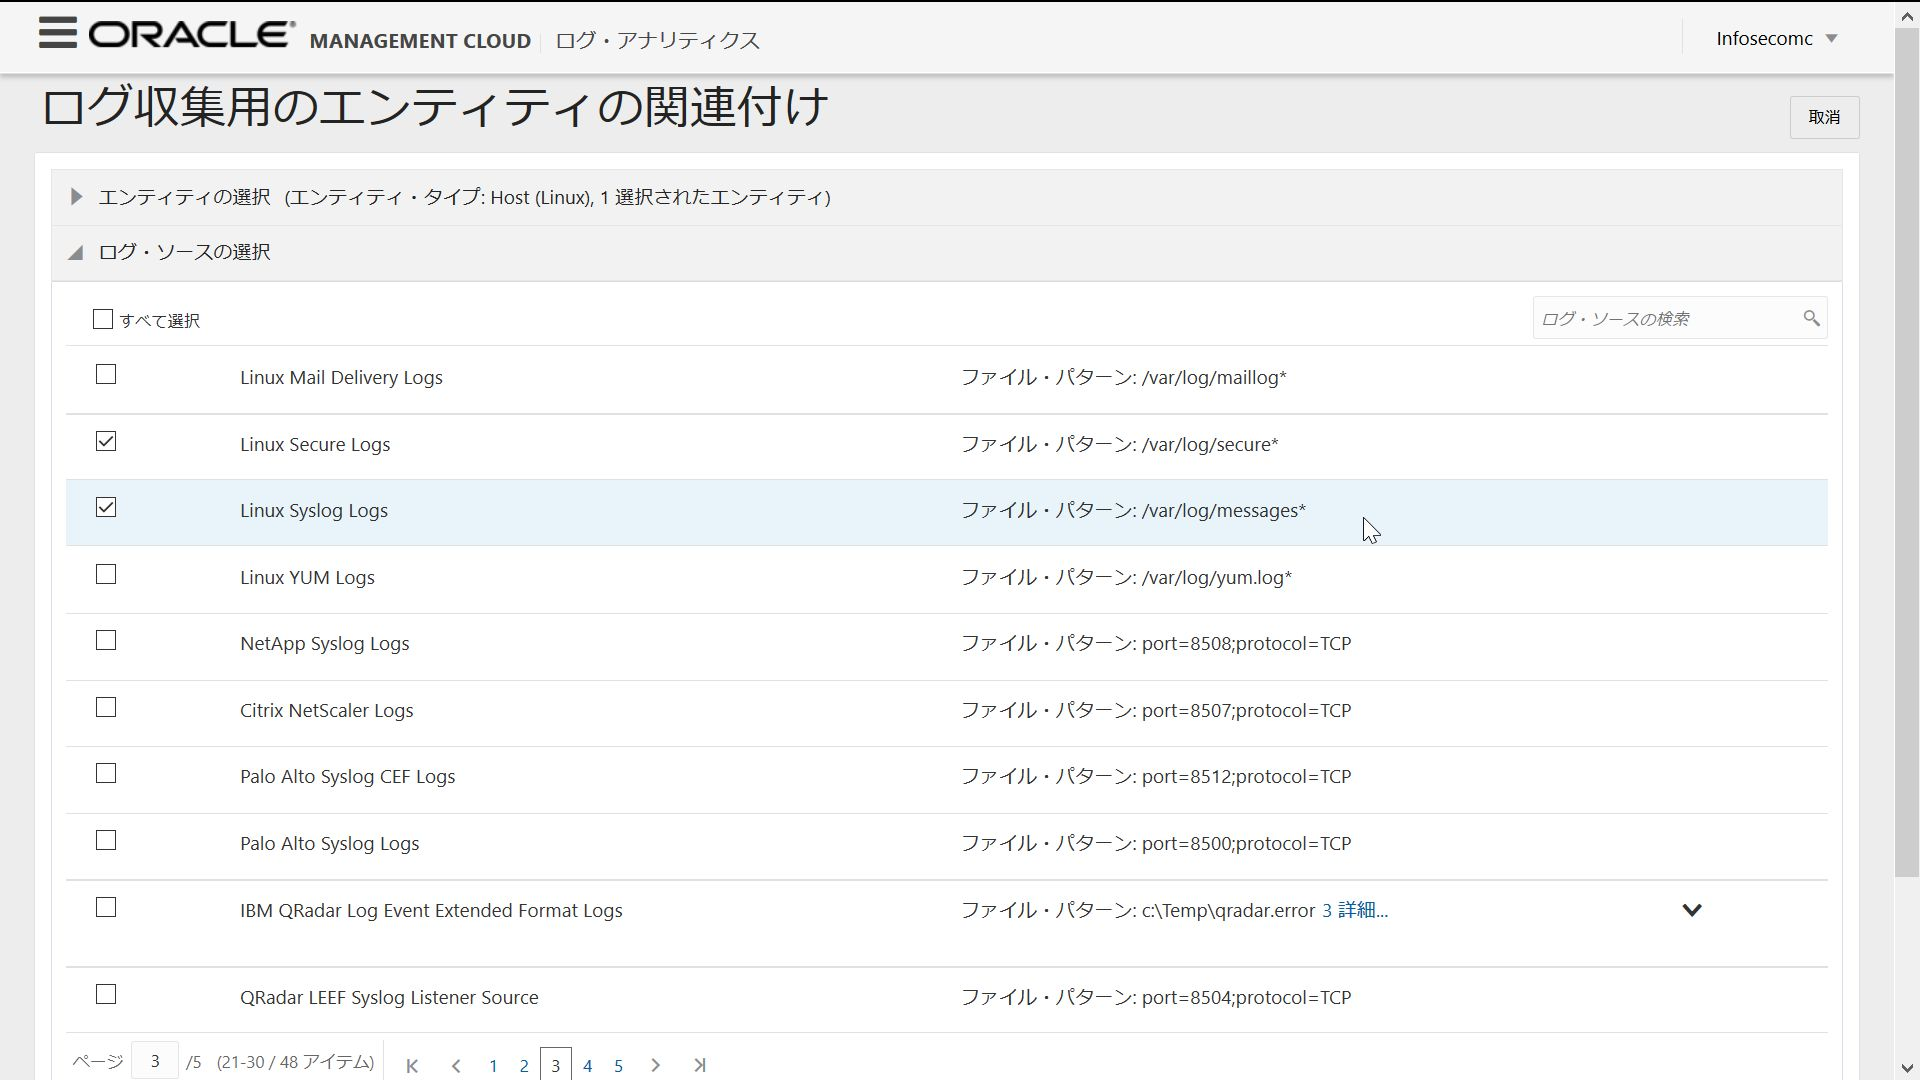
--Select Linux Secure Logs and Linux SysLogs Logs and click the Continue button at the bottom
--Click Entity Association

--This completes the settings for Cloud Agent to collect two OS log files.

--The opc user who installed Cloud Agent does not have access permission to the log file in the / var / log directory, so grant reference permission with the following command.
$ sudo setfacl -m u:opc:r /var/log/messages*
$ sudo setfacl -m u:opc:r /var/log/secure*
--When Syslog and SecureLog are displayed on the Log Analytics screen, the settings are OK.

- Example of use
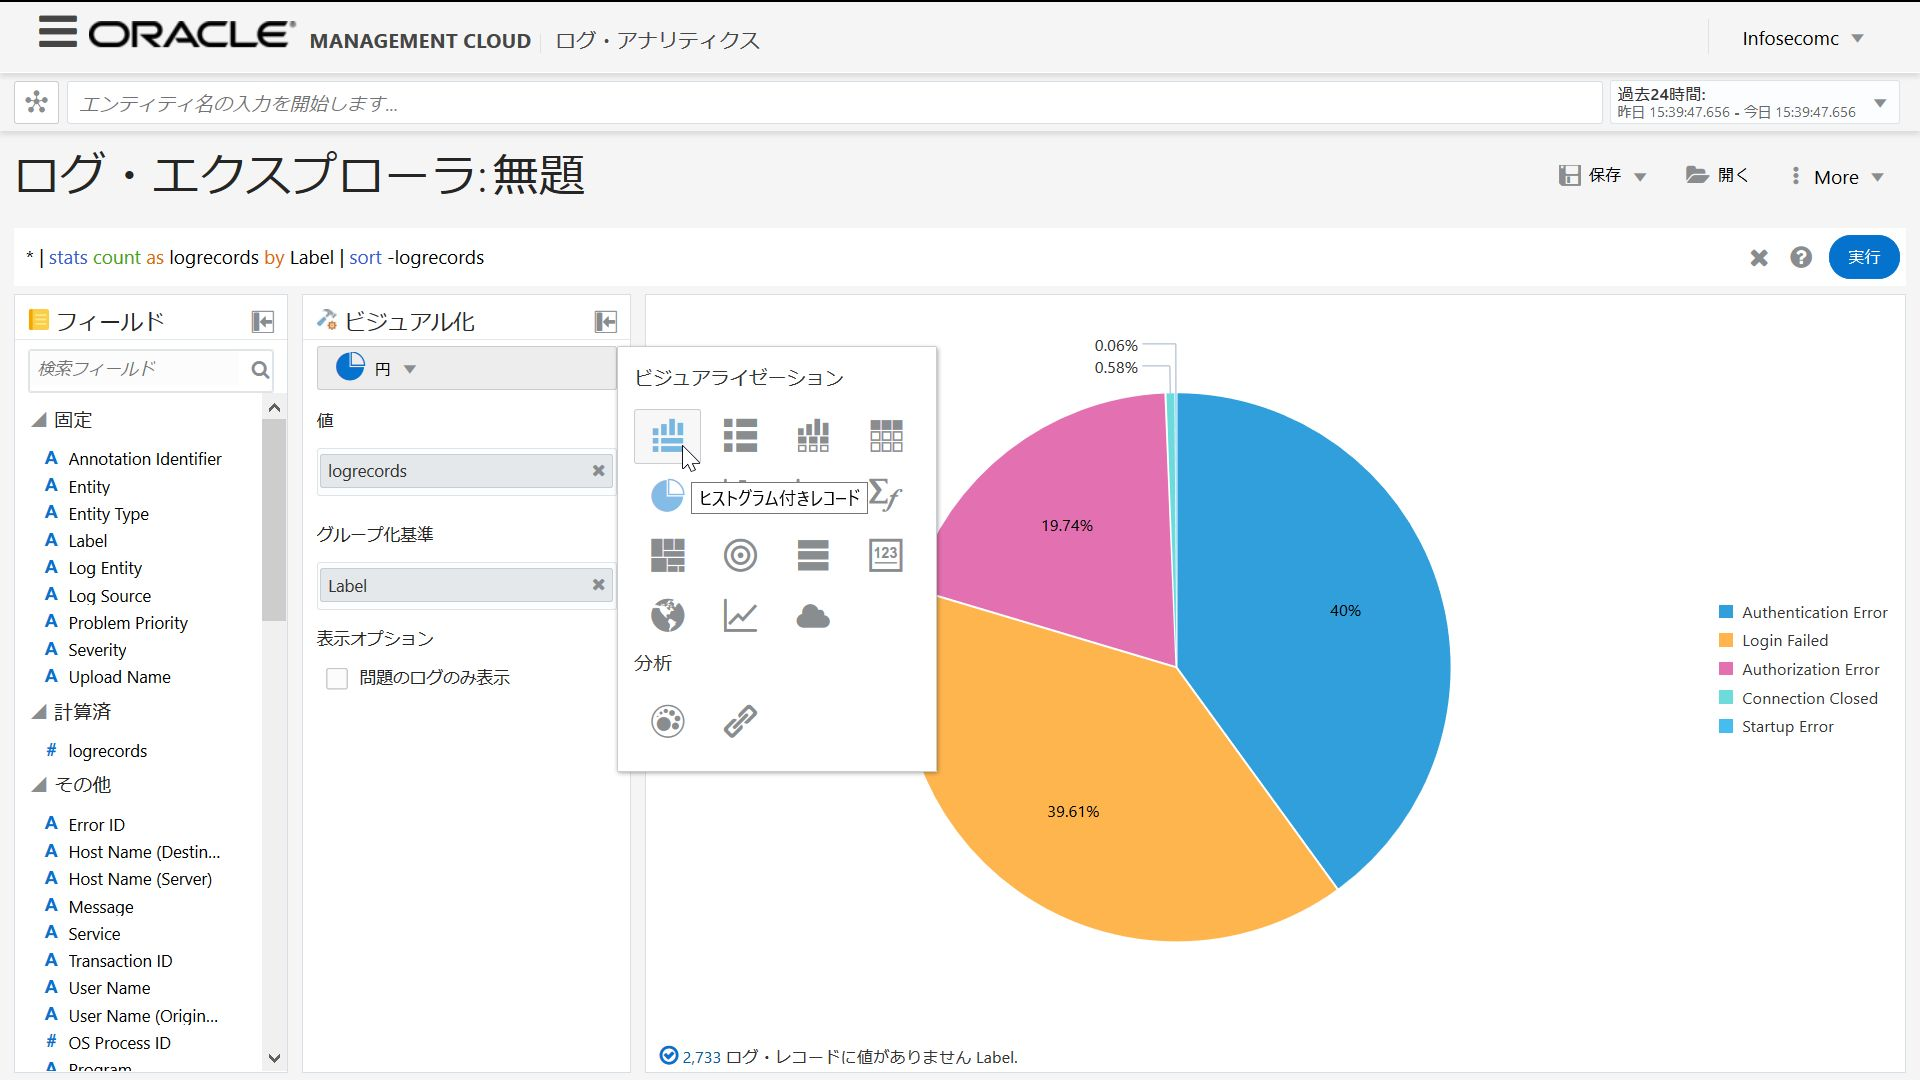
Drag and drop Lable fields to grouping criteria. The pie charts on the right are grouped by labeled log type

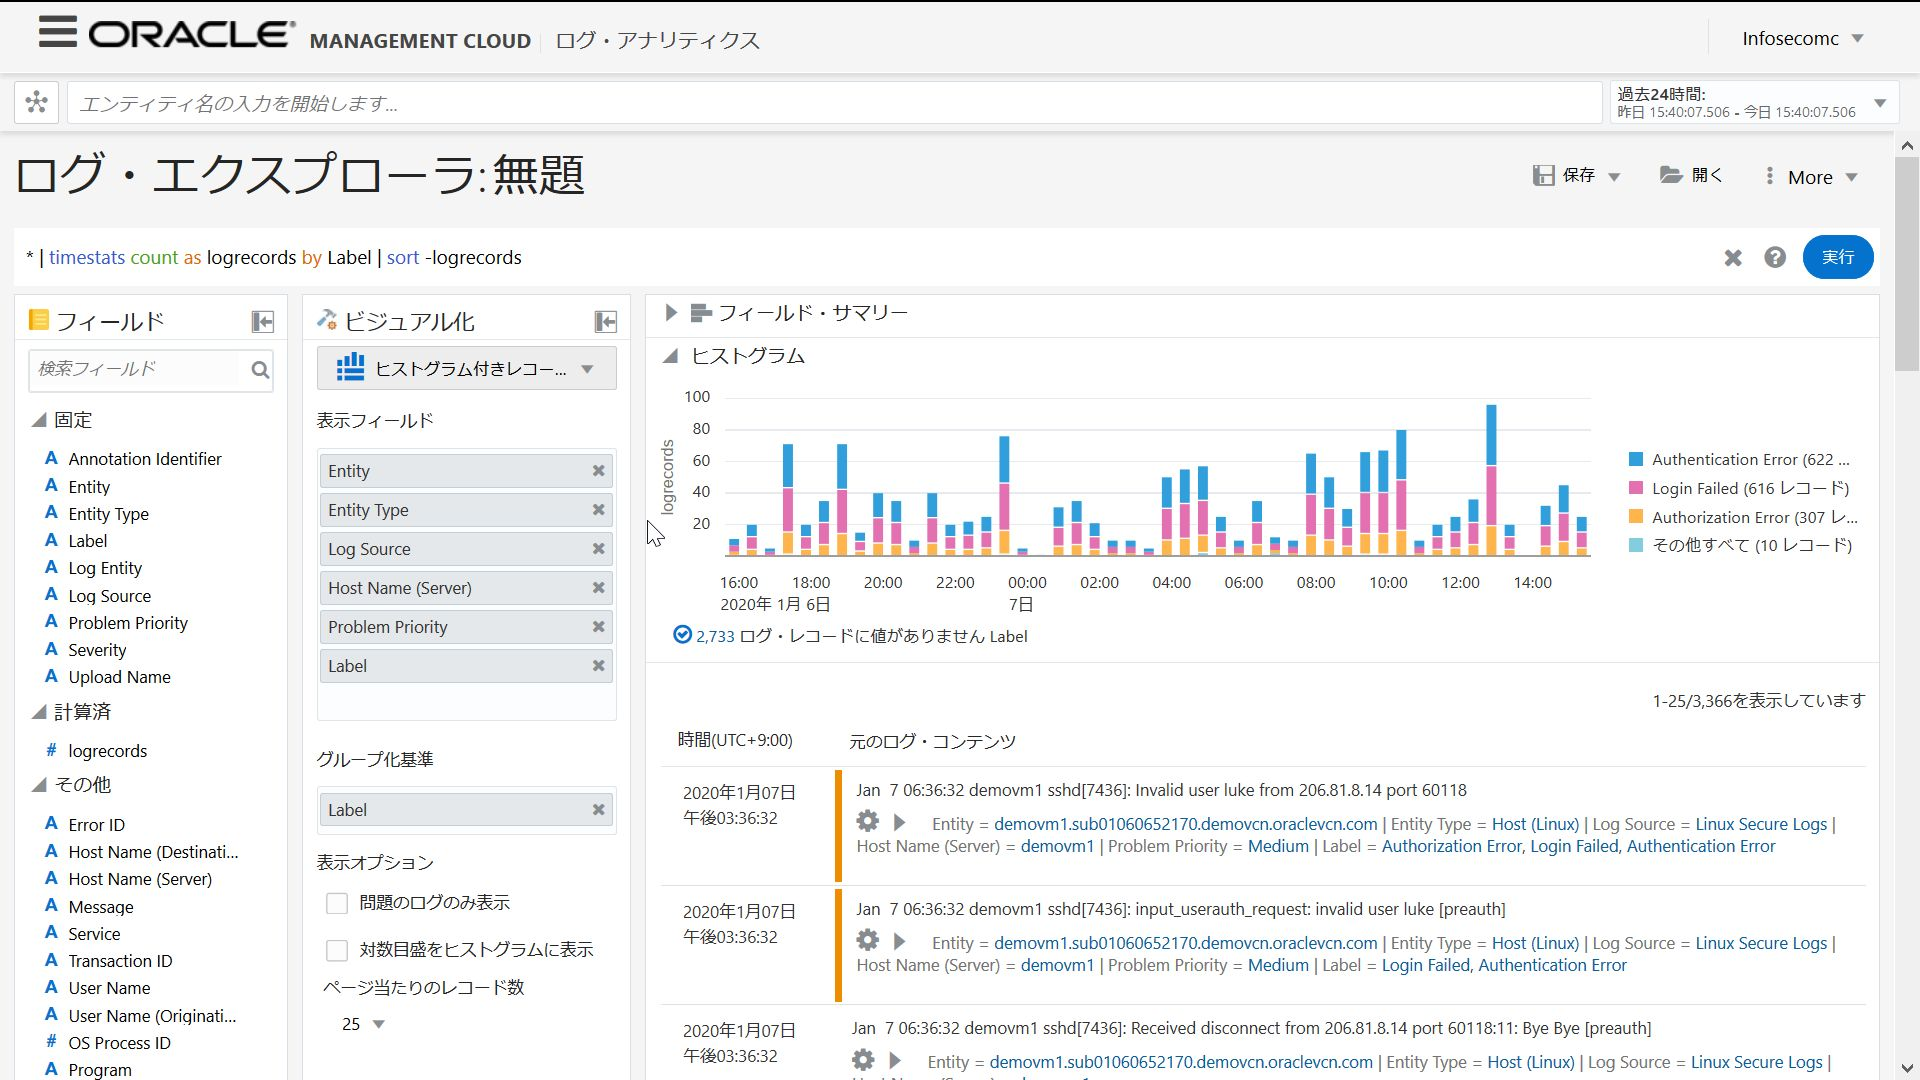
--Select a record with a histogram from the visualization
--Time series log output status
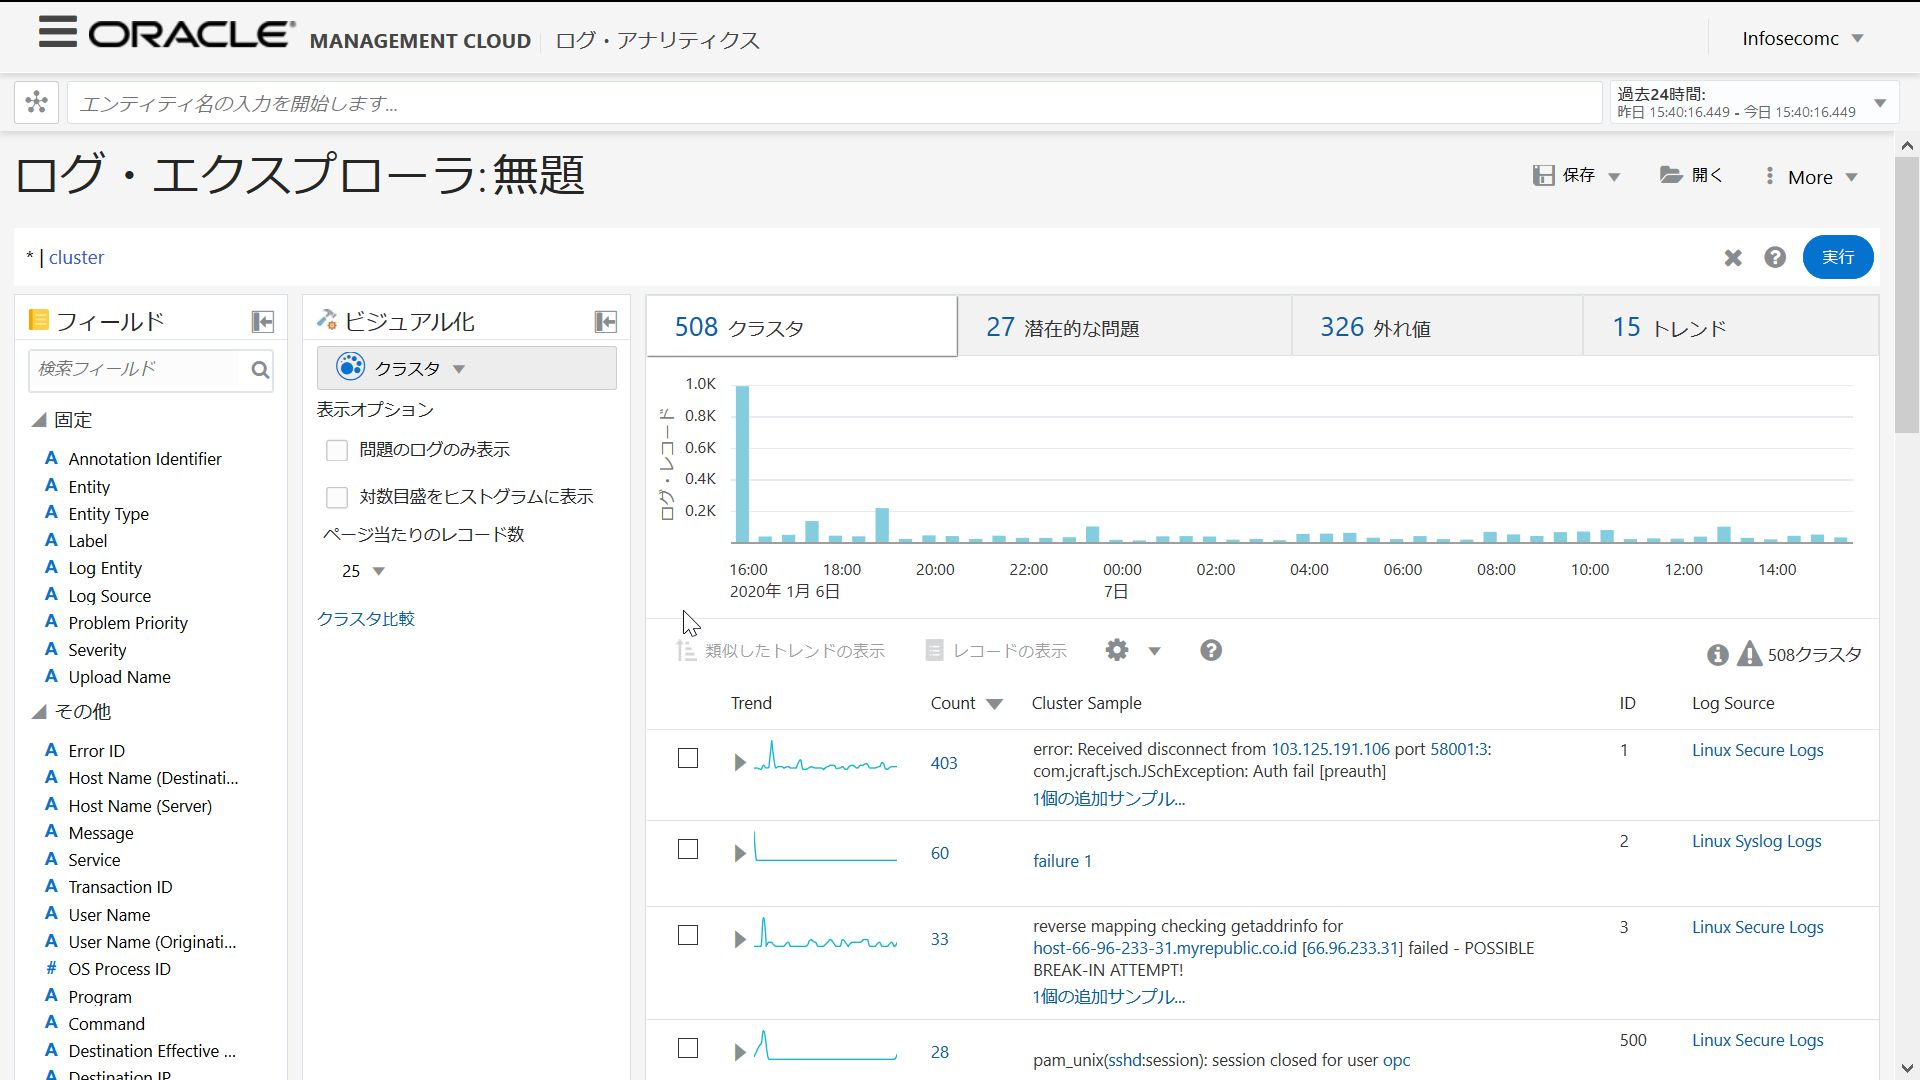
--When you select a cluster from the visualization, the logs are clustered (classified).
It makes it easier to identify target records, such as potentially problematic records and rarely occurring records.
Cloud Agent periodically sends updated log records to OMC, and the log data is always up to date. This time, I set up to import basic Linux logs, but in addition to this, Log Analytics has a log parser prepared in advance.
Available List of log parsers
If you have a unique log format that is not here, you can also capture and analyze the log by creating your own custom parser. Below you will find instructions on how to manually capture logs and a custom parser.
Click here for information related to Oracle Management Cloud (https://qiita.com/western24/items/1e44bfcaa77f3251a263)
Recommended Posts