NumPy example collection for those who are not good at math
NumPy is an extension module for Python that is useful for performing scientific and technological calculations, especially for matrix and multidimensional array calculations.
But even if you don't use math, NumPy is useful.
In particular, it may be more convenient to use an array of NumPy instead of using multiple lists like [[1,2], [3,4], [5,6]].
This time, I would like to introduce the usage of arrays mainly in NumPy with examples.
Introduction
NumPy is a library for mathematics, but NumPy arrays have some useful parts that are not related to mathematics. However, many of the samples on the web are used in mathematics, and I thought it would be difficult to understand how to use them in other than mathematics.
So the purpose of this article is to show you the convenience of NumPy (mainly arrays) by exemplifying some uses that have little to do with mathematics.
I'm not good at mathematics, and I don't use it, so I can hardly understand it.
Of course, programming is not a little related to mathematics, so it doesn't mean that you don't use it at all. Mathematics here refers to the use of programming to express mathematical formulas used in matrices and calculus.
Some of the content is math-like, but even if you don't understand it, it has nothing to do with the main subject, so don't worry about it.
Precautions for use
The examples provided here provide hints for learning how to manipulate data, and the code provided is not always efficient.
When actually using it in operation, be sure to verify it yourself.
Target readers
Python users who have never used NumPy. Especially for those who are not good at math and avoid NumPy, and those who are unrelated to math and do not use NumPy.
Execution environment
OS, processing system, etc.
The environment where the operation was confirmed is mainly this ↓.
- Python 3.5.2 | Anaconda 4.1.1 (64-bit)
- Windows 7 64bit
I have not confirmed all of them, but I do not deal with OS-dependent ones in particular. The results are mainly for interactive environments, but there are also places where Jupyter Notebook is used.
Module tool you are using
Of the following, the only standard module is calendar.
| Module name | version | Description |
|---|---|---|
| NumPy | 1.11.1 | Numerical calculation library module that will be the main character of this time |
| calendar | (3.5.2) | Standard module for working with text calendars |
| PIL | 1.1.7 | Image processing module |
| Matplotlib | 1.5.1 | Module for plotting graph This time used for image display |
| Jupyter Notebook | 4.2.1 | REPL that can be used on a web browser |
- The version of Jupyter Notebook is that of Notebook Server.
Basic knowledge
To use the NumPy module numpy, it is common to use the alias np.
This is also the case with the official reference.
import numpy as np
This article follows suit. In the text, always read as imported, even if this import is not present.
The NumPy array is of the type numpy.ndarray (hereafter referred to as" NumPy array "in the text).
>>> np.array([1, 2])
array([1, 2])
>>> type(np.array([1, 2]))
<class 'numpy.ndarray'>
This looks like a standard list, but NumPy arrays are much richer than that. See the article linked below for differences in nature from the standard list.
Basics of NumPy Arrays — Encounter with Python for Machine Learning http://www.kamishima.net/mlmpyja/nbayes1/ndarray.html
Text calendar-Conversion from 1D array to 2D
A text calendar is one that displays a textual calendar on the console.
The text calendar is also output by the cal command in the Unix-like environment.
In fact, the standard Python module has a module calendar that handles the" text calendar "itself.
calendar – Date handling-Python Module of the Week http://ja.pymotw.com/2/calendar/
So you don't have to bother to make it from scratch, but it was an easy-to-understand subject as an example of using NumPy, so I took it up.
In this section, we will consider how to handle it with almost no calendar module.
I wrote "almost" because to make a text calendar, you need to calculate the first day and the last day of the month, but it is not the purpose of this time to think about that calculation, so to find it calendar This is because it uses the monthrange ()function of themodule.
Processing image
Now let's get down to the main topic.
As you can see by looking at the actual calendar, the text calendar is 90% 9 minutes complete if you apply appropriate values to a 7x6 fixed size 2D table. However, I feel that processing is troublesome if it is two-dimensional from the beginning. It seems better to create the data in a one-dimensional array and then convert it to two dimensions later.
NumPy arrays have a reshape () method that transforms an N-dimensional array into any dimension.
You can use it to convert a one-dimensional array to two-dimensional.
Roughly speaking, it will be OK if you process according to the following flow.
・ First empty data (1D)
・ 1-31 (1D)
・ Empty data at the end (1D)
↓ Combine
・ First empty data + 1-31 + Last empty data (1D) * Size is 42
↓ Convert to 2D(reshape)
・ First empty data + 1-31 + last empty data (2D)
↓ Convert each element to a character string
・ Calendar data (2D)
Generate one-dimensional data
First, use the calendar.monthrange () function to find the required number.
>>> import calendar
>>>
>>> w, c = calendar.monthrange(2016, 7)
>>> w #The first day of the month
4
>>> c #Days of the month
31
For the first day of the month, the day of the week starting on Monday is returned. That is, Monday is 0 and Sunday is 6.
This time I want to make a calendar that starts on Sunday, so I will correct it.
#(Continued)

>>> w = w + 1 if w < 6 else 0
>>> w
5
To create an array with zeros set, use the np.zeros () function.
To create an array of numbers, use the np.arange () function, which is similar to the standard range () function.
If you do not specify dtype, the default data type is float64.
#(Continued)

>>> np.zeros(1).dtype
dtype('float64')
>>> np.zeros(1, dtype=int).dtype
dtype('int32')
>>> np.zeros(w, dtype=int)
array([0, 0, 0, 0, 0])
>>> np.arange(start=1, stop=c+1, dtype=int)
array([ 1,  2,  3,  4,  5,  6,  7,  8,  9, 10, 11, 12, 13, 14, 15, 16, 17,
       18, 19, 20, 21, 22, 23, 24, 25, 26, 27, 28, 29, 30, 31])
>>> np.zeros(42 - w - c, dtype=int)
array([0, 0, 0, 0, 0, 0])
You can concatenate arrays with the np.concatenate () function.
Please note that if you calculate two NumPy arrays with +, it will be a vector / matrix calculation.
#(Continued)

>>> np.array([1, 2]) + np.array([3, 4])
array([4, 6]) #Sum as a vector
>>> headfiller = np.zeros(w, dtype=int)
>>> days = np.arange(start=1, stop=c+1, dtype=int)
>>> tailfiller = np.zeros(42 - w - c, dtype=int)
>>> np.concatenate((headfiller, days, tailfiller))
array([ 0,  0,  0,  0,  0,  1,  2,  3,  4,  5,  6,  7,  8,  9, 10, 11, 12,
       13, 14, 15, 16, 17, 18, 19, 20, 21, 22, 23, 24, 25, 26, 27, 28, 29,
       30, 31,  0,  0,  0,  0,  0,  0])
You can also prepare 42 zeros first and overwrite them with the sequence of days. In this case, please note that an error will occur if the size of the array to be overwritten and the size of the range do not match.
#(Continued)

>>> days = np.zeros(42, dtype=int)
>>> days[w:w+c] = np.arange(start=1, stop=c+1, dtype=int)
>>> days
array([ 0,  0,  0,  0,  0,  1,  2,  3,  4,  5,  6,  7,  8,  9, 10, 11, 12,
       13, 14, 15, 16, 17, 18, 19, 20, 21, 22, 23, 24, 25, 26, 27, 28, 29,
       30, 31,  0,  0,  0,  0,  0,  0])
If it's easier to generate from a standard list, convert it to a NumPy array later with the np.array () function.
dtype retains the type of the original list.
#(Continued)

>>> days = np.array([0] * w + list(range(1, c+1)) + [0] * (42 - w - c))
>>> days.dtype
dtype('int32')
>>> days
array([ 0,  0,  0,  0,  0,  1,  2,  3,  4,  5,  6,  7,  8,  9, 10, 11, 12,
       13, 14, 15, 16, 17, 18, 19, 20, 21, 22, 23, 24, 25, 26, 27, 28, 29,
       30, 31,  0,  0,  0,  0,  0,  0])
You now have a one-dimensional array calendar.
Convert a one-dimensional array to a two-dimensional array
Then convert this to a two-dimensional array.
Since the dimension is specified in the order of rows and columns, it will be (6, 7).
#(Continued)

>>> days.reshape((6, 7))
array([[ 0,  0,  0,  0,  0,  1,  2],
       [ 3,  4,  5,  6,  7,  8,  9],
       [10, 11, 12, 13, 14, 15, 16],
       [17, 18, 19, 20, 21, 22, 23],
       [24, 25, 26, 27, 28, 29, 30],
       [31,  0,  0,  0,  0,  0,  0]])
After that, convert the numerical value to the character string representation, and the data is completed.
Convert each element to a string representation
To create a new list by transforming each element of the list, the standard functions use the map () function and list comprehensions.
To do something similar with a NumPy array, use the np.vectorize () function.
#(Continued)

>>> mapper = np.vectorize(lambda x: "  " if x == 0 else "%2d" % x)
>>> mapper
<numpy.lib.function_base.vectorize object at 0x0000000002D3C668>
>>> mapper(days.reshape((6, 7)))
array([['  ', '  ', '  ', '  ', '  ', ' 1', ' 2'],
       [' 3', ' 4', ' 5', ' 6', ' 7', ' 8', ' 9'],
       ['10', '11', '12', '13', '14', '15', '16'],
       ['17', '18', '19', '20', '21', '22', '23'],
       ['24', '25', '26', '27', '28', '29', '30'],
       ['31', '  ', '  ', '  ', '  ', '  ', '  ']],
      dtype='<U2')
The function object created by vectorize is like a partial application of the conversion function to themap ()function.
Applying an array to this function object will return a mapped array.
The processing order of this mapping and reshape can be reversed.
All you have to do is combine and output. Decorate as you like.
#(Continued)

>>> strdays2d = mapper(days.reshape((6, 7)))
>>> print("\n".join([" ".join(x) for x in strdays2d]))
                1  2
 3  4  5  6  7  8  9
10 11 12 13 14 15 16
17 18 19 20 21 22 23
24 25 26 27 28 29 30
31
Completed version
Finally, I will post a summary of the functions.
--Python code for text calendar
import numpy as np
import calendar

def print_calendar(y, m):
    w, c = calendar.monthrange(y, m)
    w = w + 1 if w < 6 else 0
    #Version sandwiched between zero arrays
    headfiller = np.zeros(w, dtype=int)
    tailfiller = np.zeros(42 - w - c, dtype=int)
    days = np.concatenate((headfiller, np.arange(start=1, stop=c+1, dtype=int), tailfiller))
    #The version that makes zero first
    # days = np.zeros(42, dtype=int)
    # days[w:w+c] = np.arange(start=1, stop=c+1, dtype=int)
    #Version made from standard list
    # days = np.array([0] * w + list(range(1, c+1)) + [0] * (42 - w - c))
    mapper = np.vectorize(lambda x: "  " if x == 0 else "%2d" % x)
    strdays2d = mapper(days).reshape((6, 7))
    print("%d %d" % (y, m))
    print()
    print("\n".join([" ".join(x) for x in strdays2d]))

if __name__ == "__main__":
    print_calendar(2016, 8)
- Execution result
2016 8

    1  2  3  4  5  6
 7  8  9 10 11 12 13
14 15 16 17 18 19 20
21 22 23 24 25 26 27
28 29 30 31
Bitmap-Generate an image from a 2D + 1D array
A bitmap that represents an image consists of a two-dimensional array of XY coordinates and information that represents the color of each pixel. Let's express this with a two-dimensional array of NumPy.
In the module used this time, colors are represented by an array of size 3 ([R, G, B]), so they are also represented in three dimensions.
Depending on the library, it may be specified in the color name or # rrggbb format, so in that case it will be expressed as a two-dimensional array of ʻint or str`.
The PIL module has abundant functions for image processing, so if you want to process images in earnest, please make full use of those functions.
Generate image with PIL
To generate an image from an array of NumPy in PIL:
import numpy as np
from PIL import Image

imgdata = np.zeros((16, 16, 3), dtype=np.uint8)
imgdata[:] = [255, 0, 0]

im = Image.fromarray(imgdata)
im.show() #Displayed as a BMP file in Image Viewer on Windows
im.save("/path/to/image.png ", "PNG")
By setting ʻimgdata [:] = ... `, you can assign the same value to all elements in 2D. (The point is that it is not three-dimensional.)
ʻCreate an image object with the Image.fromarray () function. When the show ()method is executed, it will be displayed in the image viewer of the OS. You can save the image to a file by executing thesave ()` method.
Running this code will generate a 16x16 red filled PNG image file.
Draw with Matplotlib on Jupyter Notebook
An easier way is to use Matplotlib. To view the generated image directly on the Jupyter Notebook, run the following code. The data is the same as for PIL.
%matplotlib inline

import matplotlib.pyplot as plt
import numpy as np

imgdata = np.zeros((16, 16, 3), dtype=np.uint8)
imgdata[:] = [255, 0, 0]

# plt.figure(figsize = (1.75, 1.75)) #Approximately the actual size when the size is 100x100
# plt.axis("off") #Do not show scale
plt.imshow(imgdata)
# plt.show() #Erase the string representation of an object
This method automatically scales the image size by default. Also, since it is displayed as a graph, the memory is displayed. You can use the commented out code in the code example to resize or display just the image.
In the following examples, this setting is verbose, so we only use the ʻimshow ()` function.
- Execution result

- The image is reduced. (The same applies below.)
From this point onward, the one executed by Jupyter Notebook is posted, so if you do not use Jupyter Notebook, please read it as the code that outputs the file with PIL.
Process in a loop
Here we will look at how to manipulate NumPy multidimensional arrays through bitmap manipulation.
Let's make a 100x100 image.
Then, let's change the value by making green correspond to the numerical values of x and y.
Arrays in NumPy are designed to handle multidimensional arrays naturally, such as ʻimgdata [y, x]. It should be noted that access to a 2D array is [y, x]` because the 1st dimension means the vertical direction and the 2nd dimension means the horizontal direction.
The following example is the process of setting color information for each element in a loop.
Only the green value is changed using the x and y values.
%matplotlib inline

from matplotlib.pyplot import imshow
import numpy as np

w, h = 100, 100 #width and height
imgdata = np.zeros((w, h, 3), dtype=np.uint8)
for x, y in [(x, y) for x in range(w) for y in range(h)]:
    imgdata[y, x] = [0, x + y, 0]

imshow(imgdata)
- Execution result
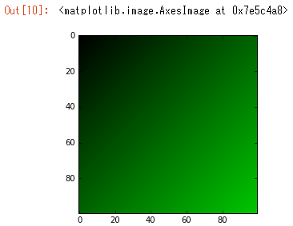
I was able to draw a green gradation.
Process in range
You can also specify a range and set the same value there.
By setting [10:30, 50:80], all the elements in the rectangular range whose vertices are (50, 10), (50, 30), (80, 30), (80, 10) Can be specified.
%matplotlib inline

from matplotlib.pyplot import imshow
import numpy as np

w, h = 100, 100
imgdata = np.zeros((w, h, 3), dtype=np.uint8)
imgdata[10:30, 50:80] = [0, 0, 255]

imshow(imgdata)
- Execution result

variation
You can combine these to draw patterns and shapes.
The following code is an example of drawing an image by combining loop processing and range processing.
- The sin function and cos function are for obtaining periodic values, and knowledge of mathematics is not relevant here, so you do not have to think hard.
--Python code example to draw a pattern and several rectangles
%matplotlib inline

from matplotlib.pyplot import imshow
import numpy as np
from math import sin, cos

w, h = 100, 100
a = np.zeros((w, h, 3), dtype=np.uint8)
for x, y in [(x, y) for x in range(w) for y in range(h)]:
    v = int(127 + sin(x * 0.6) * cos(y * 0.6) * 128)
    a[y, x] = [v, v, 0]
a[10:30, 10:70] = [int("ff", 16), int("66", 16), 0]
a[20:50, 20:80] = [int("ff", 16), int("cc", 16), 0]
a[30:70, 30:90] = [int("66", 16), int("ff", 16), 0]

imshow(a)
- Execution result

Sudoku-Extracting slices (partial arrays) such as rows and columns
Sudoku, or Number Place, is a type of number puzzle. It is a puzzle that fills the numbers from 1 to 9 in the 9x9 table so that the same numbers do not enter vertically, horizontally, and 3x3.
Sudoku-Wikipedia https://ja.wikipedia.org/wiki/%E6%95%B0%E7%8B%AC
Let's create a program that solves Sudoku using a two-dimensional array of NumPy. You don't need to know Sudoku because we're only dealing with very simple logic here.
The simplest logic to fill in numbers is to look for numbers that aren't used vertically, horizontally, or 3x3 in a square. An array of NumPy is useful for retrieving vertical, horizontal, and 3x3 number lists. However, the NumPy array alone can be a bit cumbersome, so use it in combination with the standard collection type.
Use the following two-dimensional array as sample data in question. Zero indicates an unfilled cell.
grid = np.array([
[3, 0, 0, 0, 0, 9, 0, 0, 8],
[0, 0, 0, 0, 0, 6, 7, 0, 0],
[9, 8, 2, 0, 0, 0, 6, 0, 0],
[0, 9, 0, 0, 3, 0, 4, 0, 0],
[0, 3, 5, 0, 0, 0, 2, 1, 0],
[0, 0, 7, 0, 2, 0, 0, 9, 0],
[0, 0, 4, 0, 0, 0, 9, 7, 5],
[0, 0, 9, 6, 0, 0, 0, 0, 0],
[8, 0, 0, 4, 0, 0, 0, 0, 2],
])
Take out a slice (partial array)
When 9x9 is represented by a standard multiple list, it's hard to retrieve a list of columns or a list of 3x3, aside from the list of rows.
NumPy makes it easy to operate as a two-dimensional table.
For the sake of clarity, we have provided numbered and colored images of the Sudoku questions.

Let's find out about the square of f4 by referring to this image.
Extract the array of f columns (green), the array of 4 rows (beige), and the array of d4-f6 3x3 (yellow).
3x3 is retrieved as a two-dimensional array, so use the reshape () method to convert it to one-dimensional.
The extracted array is converted to list for ease of use.
As mentioned in the bitmap section, access to a 2D array means vertical in the 1st dimension and horizontal in the 2nd dimension.
Please note that it is [y, x], not [x, y].
You can get a slice (partial array) by doing something like grid [:, 5], grid [3,:], grid [3: 6, 3: 6].
If you use the same range specification in an assignment expression, you can assign to the entire range, as shown in the bitmap section.
#(Continued)

>>> list(grid[:, 5]) #Column f: x=5 columns
[9, 6, 0, 0, 0, 0, 0, 0, 0]
>>> list(grid[3, :]) #Line 4: y=3 rows
[0, 9, 0, 0, 3, 0, 4, 0, 0]
>>> list(grid[3:6, 3:6].reshape(9)) # d4-f6
[0, 3, 0, 0, 0, 0, 0, 2, 0]
Aggregate the number list
From here, we will process without using the NumPy array.
Once you have a list of columns, a list of rows, and a 3x3 list, you can combine them and convert them to the set type to get a unique list of numbers that are already in use.
#(Continued)

>>> used_nums = set(list(grid[:, 5]) + list(grid[3, :]) + list(grid[3:6, 3:6].reshape(9)))
>>> used_nums
{0, 2, 3, 4, 6, 9}
You don't need a zero, but it's okay to have one, so leave it as it is. You can remove zeros with ʻused_nums-{0}`.
If you remove the numbers that are already in use from the sequence of numbers 1-9, you will have candidate numbers.
Use the set type - operation to remove the numbers used.
#(Continued)

# range(1, 10)Is a number from 1 to 9
>>> unused_nums = set(range(1, 10)) - used_nums
>>> unused_nums
{8, 1, 5, 7}
If there is only one unused number, it will determine the number in that square.
f4 could not be narrowed down to one in the current state.
Let's look at c2 as well.
#(Continued)

>>> col = list(grid[:, 2]) #Column c: x=2 columns
>>> row = list(grid[1, :]) #Line 2: y=1 line
>>> sq = list(grid[0:3, 0:3].reshape(9)) # a1-c3
>>> col, row, sq
([0, 0, 2, 0, 5, 7, 4, 9, 0], [0, 0, 0, 0, 0, 6, 7, 0, 0], [3, 0, 0, 0, 0, 0, 9, 8, 2])
>>> used_nums = set(col + row + sq)
>>> used_nums
{0, 2, 3, 4, 5, 6, 7, 8, 9}
>>> unused_nums = set(range(1, 10)) - used_nums
>>> unused_nums
{1}
This time, the numbers were narrowed down to only 1.
So, it was confirmed that 1 will be included in c2.
Completed version (developing)
If you apply the logic so far to the unfilled squares repeatedly, the program to solve Sudoku is completed for the time being.
However, if you cannot fill even one square in one lap, you will be given up. As it is now, it implements only the basic logic in the basics, so it will not be solved unless it is a very simple problem.
I will post the code of the completed example.
--Python code example to solve Sudoku (version that can solve only simple problems)
import numpy as np

grid = np.array([
[3, 0, 0, 0, 0, 9, 0, 0, 8],
[0, 0, 0, 0, 0, 6, 7, 0, 0],
[9, 8, 2, 0, 0, 0, 6, 0, 0],
[0, 9, 0, 0, 3, 0, 4, 0, 0],
[0, 3, 5, 0, 0, 0, 2, 1, 0],
[0, 0, 7, 0, 2, 0, 0, 9, 0],
[0, 0, 4, 0, 0, 0, 9, 7, 5],
[0, 0, 9, 6, 0, 0, 0, 0, 0],
[8, 0, 0, 4, 0, 0, 0, 0, 2]])

nums = set(range(1, 10)) # 1~9
square_table = [0, 0, 0, 3, 3, 3, 6, 6, 6]

def fill(x, y):
    if (grid[y, x] != 0):
        return 0
    list1 = list(grid[:, x]) #Vertical
    list2 = list(grid[y, :]) #side
    xx, yy = square_table[x], square_table[y]
    list3 = list(grid[yy:yy+3, xx:xx+3].reshape(9)) # 3x3
    used_nums = set(list1 + list2 + list3)
    unused_nums = nums - used_nums
    if len(unused_nums) == 1:
        grid[y, x] = list(unused_nums)[0]
        return 1
    else:
        return 0

if __name__ == "__main__":
    for i in range(81):
        print("loop:", i + 1)
        filled = sum([fill(x, y) for x in range(9) for y in range(9)])
        if len(grid[grid == 0]) == 0:
            print("solved!")
            break
        if filled == 0:
            print("give up...")
            break
    print(grid)
A little supplement to this code.
Where filled = sum (...) uses list comprehensions instead of loops.
By suming the call result of eachfill ()function, the number of cells filled in the lap is calculated.
grid [grid == 0] is one of the useful features of NumPy arrays, which allows you to retrieve all the elements that match your criteria.
Here, grid == 0 is set, so all zero elements are extracted.
If you count the number of these elements, you can see the number of unfilled cells.
I'm using this to check if the problem has been solved.
We are using the conversion table square_table to calculate a 3x3 range.
You can do it with four arithmetic operations, but in this case, I think this is clearer.
- Processing result
loop: 1
loop: 2
loop: 3
loop: 4
give up...
[[3 0 6 0 0 9 5 0 8]
 [0 0 1 0 0 6 7 0 0]
 [9 8 2 0 0 0 6 0 0]
 [0 9 8 0 3 0 4 5 0]
 [0 3 5 0 0 0 2 1 0]
 [0 0 7 0 2 0 0 9 0]
 [0 0 4 0 0 0 9 7 5]
 [0 0 9 6 0 0 0 0 0]
 [8 0 3 4 0 0 1 6 2]]
The first problem I mentioned could not be solved by this logic alone. If you are interested, please try adding or modifying logic so that you can solve more advanced problems.
By the way, the first example posted on Wikipedia could be solved with this logic alone.
in conclusion
In this way, depending on the process, you can operate much more flexibly than the standard list. There are many other features in NumPy, but the ones listed here should be pretty useful.
Whether you're new to mathematics or haven't used NumPy yet, you should definitely try NumPy.
Reference material
Overview — NumPy v1.11 Manual http://docs.scipy.org/doc/numpy/index.html
100 numpy exercises http://www.labri.fr/perso/nrougier/teaching/numpy.100/
python - How do I convert a numpy array to (and display) an image? - Stack Overflow http://stackoverflow.com/questions/2659312/how-do-i-convert-a-numpy-array-to-and-display-an-image
Recommended Posts