The story of misreading the swap line of the top command
background
I sometimes check the memory usage of VPS with the top command etc. (Bottom is from Ubuntu 18.04 LTS)
top - 13:40:39 up  1:44,  0 users,  load average: 0.52, 0.58, 0.59
Tasks:   5 total,   1 running,   3 sleeping,   1 stopped,   0 zombie
%Cpu(s):  3.6 us,  5.6 sy,  0.0 ni, 88.6 id,  0.0 wa,  2.2 hi,  0.0 si,  0.0 st
KiB Mem :  8290600 total,  2456796 free,  5604452 used,   229352 buff/cache
KiB Swap: 25165824 total, 25094400 free,    71424 used.  2552416 avail Mem

  PID USER      PR  NI    VIRT    RES    SHR S  %CPU %MEM     TIME+ COMMAND
    1 root      20   0    8304    136    108 S   0.0  0.0   0:00.10 init
    4 kitakou   20   0   17620   2020   1492 T   0.0  0.0   0:04.10 top
    5 root      20   0    8308    100     60 S   0.0  0.0   0:00.00 init
    6 kitakou   20   0   16788   3396   3312 S   0.0  0.0   0:00.09 bash
   10 kitakou   20   0   17620   2032   1500 R   0.0  0.0   0:00.03 top
I mainly check the real memory and swap area on the 4th and 5th lines, but the rightmost value of the line related to swap, which is displayed as cached or avail Mem depending on the environment. here ** "What is the cache in the swap area ...? Why is it called avail Mem ...?" ** The question arose. Since the cache area is released according to the request of other applications, if there is a certain amount of cache area in the swap area as well, the lack of main memory can be compensated, so ** it is not a preferable state, but ** it works for the time being. (Because the processing speed has dropped when moving to the swap area in the first place)
However, this time, the question "Why is the cache area for speeding up in the slow swap area ...?" ** appears. Even if I looked at multiple articles, it was described as "cached swap area" etc. and it became Rin Nyapi ..., but since it has finally been resolved, I would like to summarize the results of various investigations.
result
** It was not a value on the swap area in the first place **
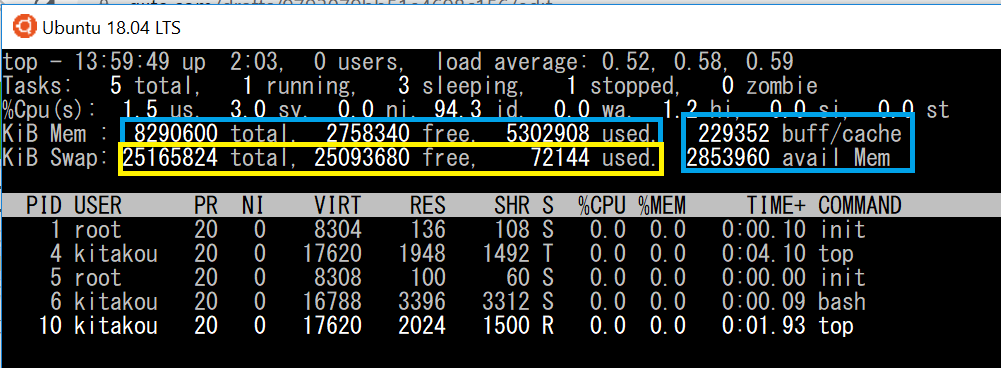
The values in memory of the top command are divided as shown in the figure below.
 The blue part is the value on the physical memory, and the yellow part is the value related to the virtual memory (that is, the swap area).
If you check with the
 man top command,
 2c. MEMORY Usage
       This portion consists of two lines which may express values in kibibytes (KiB) through exbibytes (EiB) depend‐
       ing on the scaling factor enforced with the 'E' interactive command.

       As a default, Line 1 reflects physical memory, classified as:
           total, free, used and buff/cache

       Line 2 reflects mostly virtual memory, classified as:
           total, free, used and avail (which is physical memory)

       The avail number on line 2 is an estimation of physical memory available for starting new applications,  with‐
       out  swapping.   Unlike  the  free field, it attempts to account for readily reclaimable page cache and memory
       slabs.  It is available on kernels 3.14, emulated on kernels 2.6.27+, otherwise the same as free.
It is certainly supplemented with (which is physical memory). But that's hard to understand! !! !! !! !! !! !! !! !! !! If it's written on the swap line, you'd think it's about the swao area! !! !! !! !!
Sites that were taken care of
https://piro.sakura.ne.jp/latest/blosxom/topics/2018-11-13_top-cached.htm It fits the case at the end of the above site insanely ... I want to keep in mind that I can check multiple articles and not be afraid of English ...
Recommended Posts