[JAVA] Is it OutOfMemoryError?
If you are reading this, you probably know it, but I am maintaining and developing ERP package software.
I got an OutOfMemoryError
It appears with (class name), is this the culprit? Etc. will be asked. I have to explain. In the end, when explaining to the customer, it would be nice if I could explain "what kind of operation on the menu is the trigger" with Unya Unya, but for various reasons the program side is not so simple. Therefore, it is difficult to narrow down the causes to the extent that humans, especially non-technical people, can explain them in understandable words.
So what's really happening
On the applications provided by our company, I often meet OOME mainly on the "application server". OOM ... How to explain more accurately what is actually happening in memory, how to narrow down the "criminal" or "suspect", to the point where the trouble-related person can be convinced as it is I will summarize whether it is better to explain by dropping it without lying.
Since this article is mainly written from the perspective of the program provider, we do not often pursue the cause from the "non-program" side.
1. Types of OOME
--You have run out of heap space. --Full GC was performed frequently. --You created too many threads and ran out of native memory.
etc ... There are many ways to say it, but in other words, one of them.
- Simply not enough memory. (Problems around the program)
- There is a problem with the program, such as forgetting to release memory or generating a large number of unnecessary objects. (Problem on the program side)
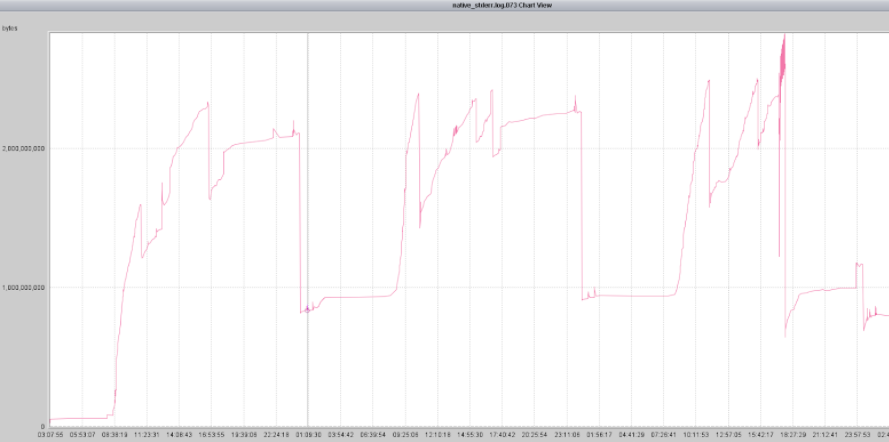
Quote: How to check OutOfMemoryError is. "Which side of the process was actually wrong?", The cause is not limited to one. So, first, let's take a bird's eye view of how memory is changing over time.
2. Garbage collector
To do this, go to Gc Mechanism first.
The heap size must be set appropriately (New area size, Old area size, area size balance, etc.) for the JVM to perform GC properly. Of course, the proper heap size depends on the application. ** Generally, if the heap size is small, GC will occur frequently and the performance of the application will decrease. ** Furthermore, if the heap size is less than the required amount, an OutOfMemoryError will occur and the application will stop. ** On the other hand, if the heap size is large, the number of GC startups will decrease, but the processing time per GC, that is, the application stop state will be long, and there may be a problem with the application response time. ** **
As a prerequisite for the above settings, we will answer mainly from the perspective of the program provider.
3. Understand and check the Gc log (https://qiita.com/opengl-8080/items/64152ee9965441f7667b#gc-%E3%83%AD%E3%82%B0%E3%82%92%E3%82%B0%E3%83%A9%E3%83%95%E3%81%A7%E7%A2%BA%E8%AA%8D%E3%81%99%E3%82%8B)
If there is any timing that jumps up, keep an eye on it. Not limited to one place.

At the time of the problem, you will be pinpointing what is suspicious. See Heapdump etc.

5. Customer business operation log
If there is such a thing, we aim to get closer to the explanation that "what kind of operation on such a menu is likely to be the trigger" by multiplying it.
6. Required log / analysis tool
To align the explanations so far, standard output, standard error output, and Heapdump/Javacore/GarbageCollector analysis In addition, if there is a log that understands user operations, I think that explanations that are relatively close to human language can be done.
Summary
How to check OutOfMemoryError Heapdump/Javacore/GarbageCollector analysis How Gc works
It's okay if you read through.
Recommended Posts