DBSCAN (clustering) with scikit-learn
About the outline of DBSCAN which is one of the clustering algorithms and simple parameter tuning I didn't seem to have a complete Japanese article, so I made a note of it. Please note that the outline of DBSCAN is a (rough) Japanese translation of wikipedia.
What is DBSCAN
- Abbreviation for
Density-based spatial clustering of applications with noise - One of the clustering algorithms
Algorithm overview
-
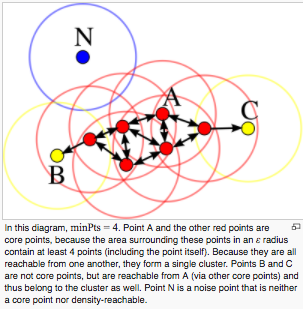
- Classify points into 3 categories
- Core points: Points with at least minPts of adjacent points within a radius of ε
- Reachable points (border points): Points that do not have as many adjacent points as minPts within a radius of ε, but have Core points within a radius of ε.
- Outlier: Points with no adjacent points within radius ε
-
- Create a cluster from a collection of Core points and assign Reachable points to each cluster.

- Create a cluster from a collection of Core points and assign Reachable points to each cluster.
[From figure wikipedia]
Pros
- Unlike k-means, you don't have to decide the number of clusters first
- Can be classified even in sharp clusters. Does not assume that the cluster is spherical
- Robust for outliers.
- There may be two parameters, ε and minPts. It is also easy to determine the parameter range.
Disadvantages
- The concept of border points is subtle, and data may change which cluster it belongs to.
- Accuracy varies depending on the distance calculation method.
- It is difficult to properly determine ε and minPts when the data is dense. In some cases, most points are classified into one cluster.
- It is difficult to determine ε without knowing the data.
- (Not limited to DBSCAN) Larger dimensions are affected by the curse of dimensionality
Difference from other algorithms
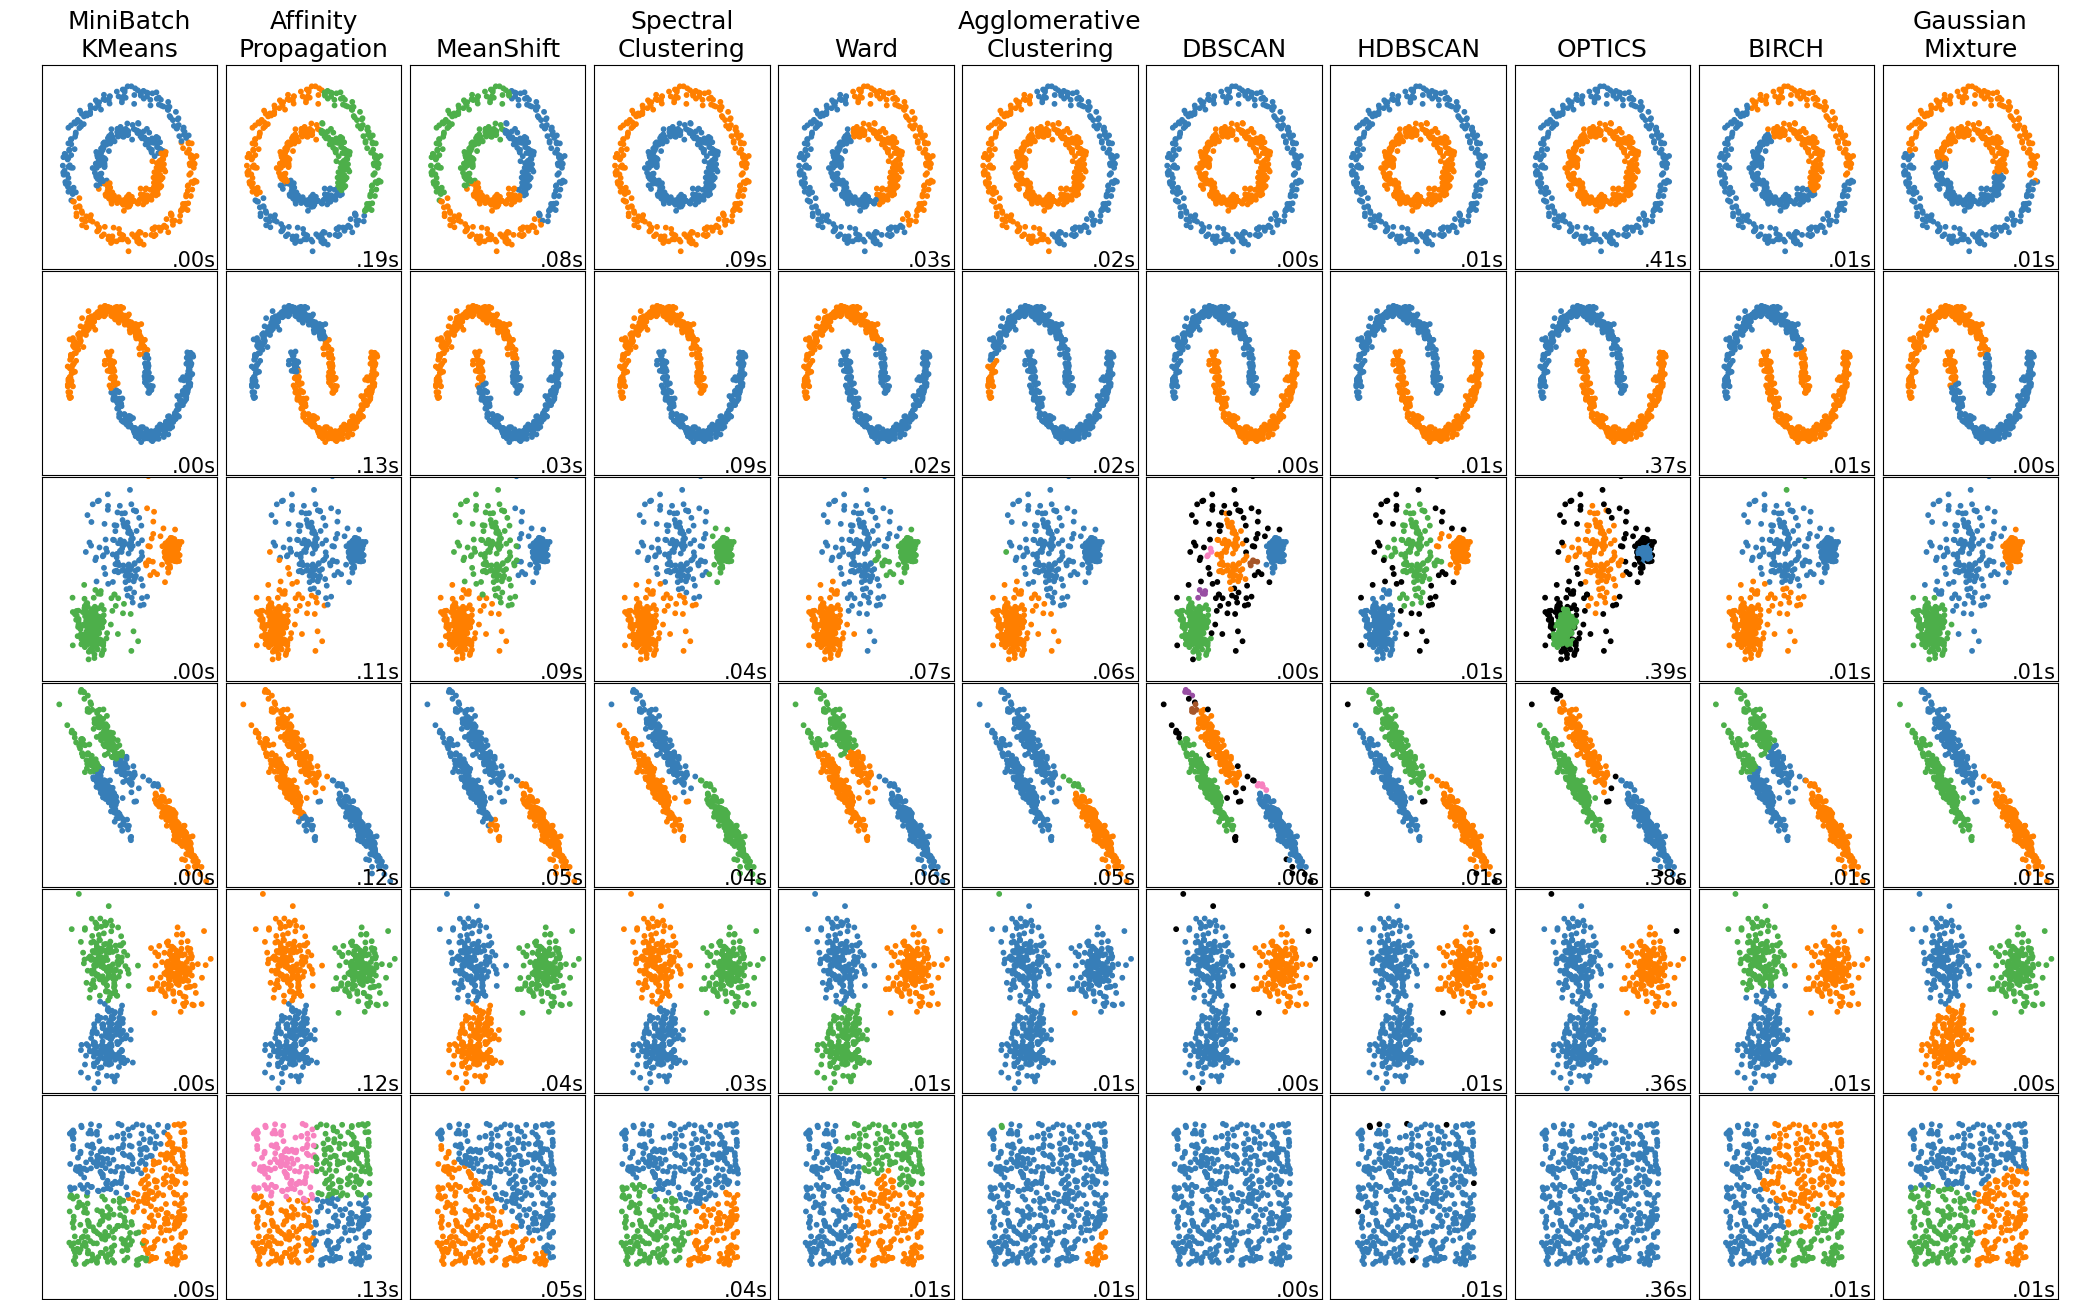
It is a comparison of each method in scikit-learn demo page, but the second from the right is DBSCAN. You can intuitively see that they are clustered based on density.

Tuning of ε and minPts
If it is two-dimensional, it can be visualized to determine whether it is classified well, but if it is three-dimensional or more, it is difficult to visualize and judge. I debugged and adjusted the outliers and the number of clusters as follows. (Using scikit-learn)
from sklearn.cluster import DBSCAN

for eps in range(0.1,3,0.1):
    for minPts in range(1,20):
        dbscan = DBSCAN(eps=eps,min_samples=minPts).fit(X)
        y_dbscan = dbscan.labels_
        print("eps:",eps,",minPts:", minPts)
        #Outlier number
        print(len(np.where(y_dbscan ==-1)[0]))
        #Number of clusters
        print(np.max(y_dbscan)))
        #Number of points in cluster 1
        print(len(np.where(y_dbscan ==0)[0]))
        #Number of points in cluster 2
        print(len(np.where(y_dbscan ==1)[0]))
DBSCAN related links
- wikipedia
- https://en.wikipedia.org/wiki/DBSCAN
- Official documentation
- http://scikit-learn.org/stable/modules/generated/sklearn.cluster.DBSCAN.html
- Official demo page
- http://scikit-learn.org/stable/auto_examples/cluster/plot_dbscan.html
- Qiita
- http://qiita.com/ynakayama/items/46d5f2e49f57c7de98a4
- http://qiita.com/yamaguchiyuto/items/82c57c5d44833f5a33c7
Postscript
Japanese Wikipedia has been updated with additional descriptions. It's easy to understand.
Recommended Posts