Full understanding of Python debugging
debug
Debugging is one of the most important skills for developers. Debugging can help you pinpoint errors and find bugs in your program. Python provides a variety of debugging tools and packages (also known as debuggers). I will introduce how to use these.
Debug with pdb
"Pdb" is a Python standard library debugging tool that provides interactive source code debugging capabilities for Python programs. .. The usage is C language "gdb" It's similar. The main function of pdb is ["breakpoint"](https://en.wikipedia.org/wiki/%E3%83%96%E3%83%AC%E3%83%BC%E3%82 Installation of% AF% E3% 83% 9D% E3% 82% A4% E3% 83% B3% E3% 83% 88), "Step Execution" /word15249.html), "[Stack Frame](https://ja.wikipedia.org/wiki/%E3%82%B3%E3%83%BC%E3%83%AB%E3%82%B9%E3 % 82% BF% E3% 83% 83% E3% 82% AF) "check, change the value of the variable dynamically, etc. pdb provides commonly used debug operation commands.
| command | 短縮command | Description |
|---|---|---|
| break | b | Setting breakpoints;b <Number of lines>で指定Number of linesにブレークポイントを設置できる |
| continue | cont/c | Resume execution until next breakpoint |
| next | n | Execute the next line; the next line does not go inside if it is a subprogram (function, etc.) |
| step | s | Execute the next line; the next line goes inside if it is a subprogram (function, etc.) |
| where | bt/w | "Stack trace"Show |
| enable | - | Enable disabled breakpoints |
| disable | - | Disable enabled breakpoints |
| pp/p | - | p <Variable name>Print variables with |
| list | l | View sources around the current line (you can view a wider range of sources with the ll command) |
| up | u | Move to the stack frame above |
| down | d | Move to the stack frame below |
| restart | run | Restart debugging |
| args | a | Print function arguments |
| clear | cl | Remove all breakpoints;cl <number>で指定numberのブレークポイントを削除できる |
| return | r | Run to the end of the function |
| help | h | h <Command name>Show command help with |
| quit | q | Quit debugging |
You can start the pdb debugger in two ways. One is to specify the pdb module as a command line argument and start the Python file.
python -m pdb test_pdp.py
The other is to set breakpoints in the pdb module set_trace in your Python code. When the program runs to the breakpoint, it automatically suspends and launches the pdb debugger.
import pdb


def factorial(n, sum=0):
    if n == 0:
        return sum

    pdb.set_trace()
    sum += n
    print(sum)
    return factorial(n-1, sum)


if __name__ == '__main__':
    factorial(5)
There is no particular difference between the two methods, but the choice is case by case. If your code is short, you can safely start pdb with the command line argument method. On the other hand, when it comes to large programs, it is easier to set breakpoints in advance with set_trace where you want to debug.
Once the pdb debugger is launched, you will be able to debug with the above command. The example below is a debug of the tail-recursive factorial function. First, I checked the call stack of the function with bt and looked at the Python code with list. Next, I printed the value of sum with p and followed the recursive return with r. And finally, I finished debugging with q.
kaito@MacBook-Pro debug % python factorial.py
> /Users/kaito/Desktop/debug/factorial.py(9)factorial()
-> sum += n
(Pdb) bt
  /Users/kaito/Desktop/debug/factorial.py(15)<module>()
-> factorial(5)
> /Users/kaito/Desktop/debug/factorial.py(9)factorial()
-> sum += n
(Pdb) list
  4     def factorial(n, sum=0):
  5         if n == 0:
  6             return sum
  7
  8         pdb.set_trace()
  9  ->     sum += n
 10         print(sum)
 11         return factorial(n-1, sum)
 12
 13
 14     if __name__ == '__main__':
-> sum += n
(Pdb) p sum
0
-> sum += n
(Pdb) r
5
> /Users/kaito/Desktop/fluent python/debug/factorial.py(9)factorial()
-> sum += n
(Pdb) r
9
> /Users/kaito/Desktop/fluent python/debug/factorial.py(9)factorial()
-> sum += n
(Pdb) r
12
> /Users/kaito/Desktop/fluent python/debug/factorial.py(9)factorial()
-> sum += n
(Pdb) r
14
> /Users/kaito/Desktop/fluent python/debug/factorial.py(9)factorial()
-> sum += n
(Pdb) r
15
--Return--
> /Users/kaito/Desktop/debug/factorial.py(11)factorial()->15
-> return factorial(n-1, sum)
(Pdb) q
Traceback (most recent call last):
...
If the output of pdb feels a little plain, there is also a package called ʻipdb that will clean up the output. It is the same image as ʻipython that cleans the REPL environment. The API is the same, so you can use it as it is by changing ʻimport pdb to ʻimport ipdb as pdb.
(tensorflow) kaito@MacBook-Pro debug % python factorial.py
> /Users/kaito/Desktop/debug/factorial.py(9)factorial()
      8     ipdb.set_trace()
----> 9     sum += n
     10     print(sum)

ipdb> r
5
> /Users/kaito/Desktop/debug/factorial.py(9)factorial()
      8     ipdb.set_trace()
----> 9     sum += n
     10     print(sum)

ipdb> r
9
> /Users/kaito/Desktop/debug/factorial.py(9)factorial()
      8     ipdb.set_trace()
----> 9     sum += n
     10     print(sum)

ipdb> r
12
> /Users/kaito/Desktop/debug/factorial.py(9)factorial()
      8     ipdb.set_trace()
----> 9     sum += n
     10     print(sum)

ipdb> r
14
> /Users/kaito/Desktop/debug/factorial.py(9)factorial()
      8     ipdb.set_trace()
----> 9     sum += n
     10     print(sum)

ipdb> r
15
--Return--
15
> /Users/kaito/Desktop/debug/factorial.py(11)factorial()
     10     print(sum)
---> 11     return factorial(n-1, sum)
     12

ipdb> q
Exiting Debugger.
It's actually colorful and more beautiful.
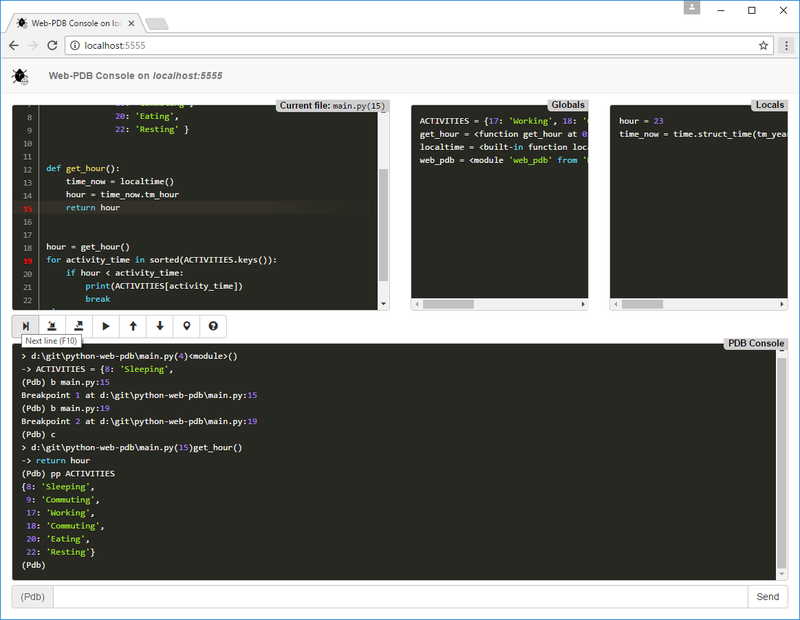
In addition to ʻipub, there is also a package that can be debugged with a browser called "[web-pdb](https://github.com/romanvm/python-web-pdb)". And the API is the same as pdb`. As an image, you can see it by looking at the figure below.
Also, if you like vim, check out "PuDB" in the CUI Debugger. The image is as shown in the figure below. It's irresistible for CUI lovers. Also, regarding how to use it, I recommend @ Kernel_OGSun's article.
Debug with breakpoint
Starting with Python 3.7, a built-in function called breakpoint has been added (PEP 553). The basic usage is as follows.
def factorial(n, sum=0):
    if n == 0:
        return sum

    breakpoint()
    sum += n
    print(sum)
    return factorial(n-1, sum)


if __name__ == '__main__':
    factorial(5)
By default, it is exactly the same as ʻimport pdb; pdb.set_trace ()`.
As an advanced usage, you can add various functions by setting an environment variable called PYTHONBREAKPOINT. For example, you can turn off debugging with PYTHONBREAKPOINT = 0, eliminating the need to erase eachbreakpoint ()in your code.
Then, by setting PYTHONBREAKPOINT ='importable.callable', ʻimportable.callable will be ʻimport and callable will be called. For example, you can use web-pdb as follows:
PYTHONBREAKPOINT='web_pdb.set_trace' python test_pdb.py
It's very convenient because you can change the debugger without changing a single line of Python code by changing only the environment variables.
Debug with Visual Studio Code
It's very easy to debug with VS Code.
First, click the bug icon from the toolbar on the left. At the first time, you need to create launch.json, but the defaults are pretty good.

You can then set a breakpoint by clicking next to the line number.

Then click Start Debugging to run it.

Then, the next screen will be displayed.

You can operate debugging using the button on the upper right.

Step Over is a function equivalent to next of pdb. Also, Step In is pdb's step, and Step Out is return. The GUI is easy to use.
Debug with PyCharm
Basically, it's the same interface as VS Code.

Start debugging with the bug icon in the upper right and end with the square icon.

When you want to operate debugging, you can mainly use this button.

Press the Futako ball on the left to enter the screen below. It is very convenient to be able to set the conditions for entering a breakpoint in Condition.

Press the calculator icon on the far right to enter the screen below. You can verify variables etc.

Summary
I've seen a lot about debugging Python. The first is the standard library pdb and its derivatives. As a Python developer, let's hold back pdb for the time being. I also looked at VS Code and PyCharm's GUI debuggers. It's basically very easy to use, so once you know the pdb, you'll be ready to use it. Of course, advanced usage has no choice but to gain experience in practice.
Recommended Posts