[Python] Whiten the parts that turn black when there is no data in the Choropleth map of Folium.
How to make black colored area in Folium Choropleth white where data is missing; simply set the nan_fill_color
About this article
Currently, I am studying Folium's Choropleth map, but I am having a hard time because many of the ones posted on the net do not work properly. Meanwhile, the ones on this site worked properly and were very helpful.
Let's make a heat map world map of Big Mac Index with Python https://techray.hatenablog.com/entry/2019/12/16/200248
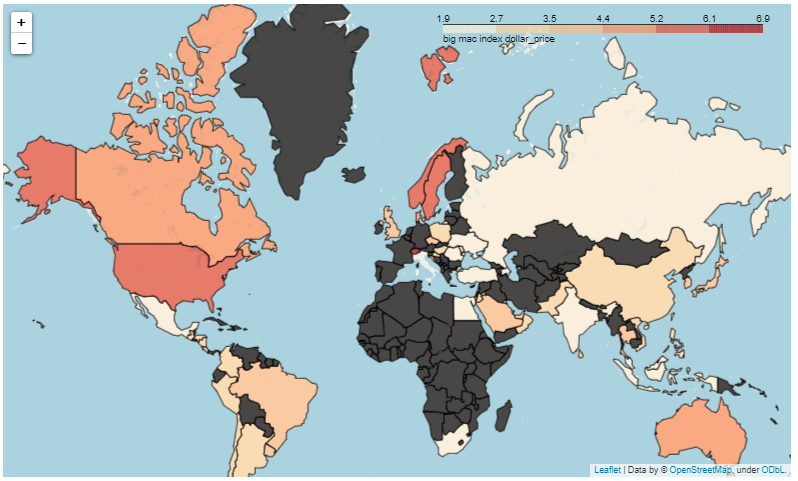
However, on the displayed map, where there is no Big Mac Index (where there is no McDonald's store ?!), it turns black and is a little difficult to see. (Strictly speaking, it is dark gray, but we will proceed as black)
BEFORE (like this)

AFTER I tried whitening black for a moment!

In this way, it is easy to see that Switzerland has the highest Big Mac.
What changed
I would like you to see the data posted on the original site there, but below, I added a line called nan_fill_color.
#Color the map
folium.Choropleth(
geo_data=geojson,
name='choropleth',
data=df,#Drawing data
columns=['iso_a3', 'dollar_price'], # ["Country code", "Column of values"]
key_on='feature.id',
fill_color='OrRd',#Color specification
fill_opacity=0.7, #Color transparency
line_opacity=1,#Border transparency
nan_fill_color="white",  ####Here, the countries that are not in df are white! !! !!#####
legend_name='big mac index dollar_price' #Usage Guide
).add_to(m)
This was mentioned in the Folium documentation, but it doesn't seem to be well known. https://python-visualization.github.io/folium/modules.html
nan_fill_color (string, default 'black') – Area fill color for nan or missing values. Can pass a hex code, color name.
Those without a value are treated as NaN, and it seems that you can specify the color. In addition to specifying the color, you can also change the transparency.
Other
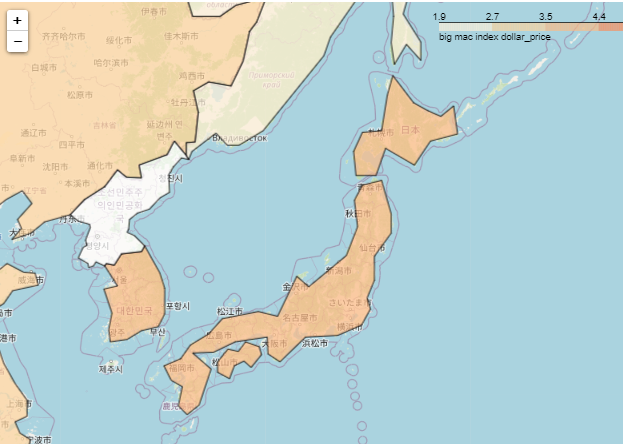
The data of this Coropress diagram was quite rough. Japan looks like this. ..
 After all, it is easy to understand that the boundaries are connected by points and represented by polygons.
Recommended Posts