[Python] How to do PCA in Python
Use ** scikit-learn ** to do ** PCA ** in Python. There are many explanations of PCA in the world, so I will not explain it here, but just explain how to use it.
Usage is simple. n_components is the number of components. If nothing is specified, it will be the number of dimensions of the data. All you have to do now is pass the data to fit.
from sklearn.decomposition import PCA
pca = PCA(n_components=2)
pca.fit(X)
Details can be found here [http://scikit-learn.org/stable/modules/generated/sklearn.decomposition.PCA.html#sklearn.decomposition.PCA.fit_transform).
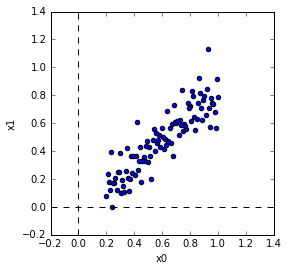
Test data creation
I created the test data like this. It doesn't matter whether shuffle is separate or not.
In [10]: x = np.linspace(0.2,1,100)

In [11]: y = 0.8*x + np.random.randn(100)*0.1

In [12]: X = np.vstack([x, y]).T

In [13]: np.random.shuffle(X)
PCA PCA should be as follows.
In [14]: from sklearn.decomposition import PCA

In [15]: pca = PCA(n_components=2)

In [16]: pca.fit(X)
Out[16]: PCA(copy=True, n_components=2, whiten=False)
Confirmation of main components
** Main components ** are in components_. Incidentally, you can see the ** mean ** and ** covariance matrix ** with mean_, get_covariance ().
In [17]: print 'components'
    ...: print pca.components_
    ...: print 'mean'
    ...: print pca.mean_
    ...: print 'covariance'
    ...: print pca.get_covariance()
    ...:
components
[[ 0.71487492  0.69925235]
 [-0.69925235  0.71487492]]
mean
[ 0.6         0.47190318]
covariance
[[ 0.05441077  0.04603365]
 [ 0.04603365  0.0523763 ]]
Now let's calculate the ** mean ** and ** covariance matrix ** by ourselves. The average is the average for each component. The covariance matrix is a calculation of the covariance. (That's right) When calculating the covariance, bias = 1 is for specifying what the denominator of the variance and covariance should be. Here, 1 is specified to divide by the number of data. If it is 0, it is divided by the number of data-1. You can see that the results are the same.
In [22]: mn = np.mean(X,axis=0)

In [23]: z = X - mn

In [24]: cv = np.cov(z[:,0],z[:,1],bias=1)

In [25]: print 'mean'
    ...: print mn
    ...: print 'covariance'
    ...: print cv
    ...:
mean
[ 0.6         0.47190318]
covariance
[[ 0.05441077  0.04603365]
 [ 0.04603365  0.0523763 ]]
Then calculate the ** eigenvalues ** and ** eigenvectors ** of the ** covariance matrix **. The eigenvectors of the covariance matrix match the principal components. Eigenvalues and eigenvectors are calculated in numpy.linalg.eig.
W, v = np.linalg.eig(cv)

print 'eigenvector'
print v
print 'eigenvalue'
print W

eigenvector
[[ 0.71487492 -0.69925235]
 [ 0.69925235  0.71487492]]
eigenvalue
[ 0.09943842  0.00734865]
W is the eigenvalue and v is the eigenvector. Here, the eigenvectors are ** column vectors *. (Lined vertically) That is, v [:, 0] is the first eigenvector. Note that components_ is a ** row vector ** (side by side). You can see that they match. ( Sometimes the direction is reversed 180 degrees.)
Let's multiply the covariance matrix by the eigenvectors. Since the principal components of the eigenvector and PCA are the same, it is the same as multiplying the covariance matrix by the principal components. Since it is an eigenvector, the direction does not change.
In [28]: print cv.dot(v[:,0].reshape(2,1))
    ...: print v[:,0]*W[0]
    ...: print cv.dot(v[:,1].reshape(2,1))
    ...: print v[:,1]*W[1]
[[ 0.07108603]
 [ 0.06953255]]
[ 0.07108603  0.06953255]
[[-0.00513856]
 [ 0.00525337]]
[-0.00513856  0.00525337]
Principal component vector display
Let's display the first principal component vector and the second principal component vector on the data. You can see that the first principal component points in the direction of large dispersion.

Projection Let's ** Projection ** with the data as the main component. Projection is specifically to take the inner product of the data and the principal component vector.
In [30]: Xd = pca.transform(X)
If you actually take the inner product of the data and the principal component vector and check it, you can see that it is the same.
In [31]: print pca.components_[0]
    ...: print pca.components_[1]
    ...: print X[0,:]
    ...: print z[0,:]
    ...: print pca.components_[0].dot(z[0,:]), pca.components_[1].dot(z[0,:])
    ...: print Xd[0,:]
[ 0.71487492  0.69925235]
[-0.69925235  0.71487492]
[ 0.57979798  0.47996242]
[-0.02020202  0.00805924]
-0.00880647453855 0.0198876592146
[-0.00880647  0.01988766]
If you plot the Projected data, it will be as follows. If you look at the plotted shape, you can see that the principal component vector is rotated to the new axis.

MNIST I tried it with MNIST data. MNIST is handwritten character data. The data can be downloaded from here. The format of the data is also written here. (* This time, I borrowed the place to read the data from the sample code of Tensorflow.)
I read the data and used 256 data of character '3'. (Because there are many if you use all)

PCA has set the number of components to 50 as shown below. (50 has no particular meaning)
In [36]: from sklearn.decomposition import PCA

In [37]: N = 50

In [38]: pca = PCA(n_components=N)

In [39]: pca.fit(X)
Out[39]: PCA(copy=True, n_components=50, whiten=False)
The following is an image of the main components.

Naturally, Projection will result in 50-dimensional data. Now you can compress the dimensions.
In [44]: Xd = pca.transform(X)

In [45]: print X.shape
(256, 784)

In [46]: print Xd.shape
(256, 50)
Let's go back to the original dimension. Use inverse_transform to revert.
In [51]: Xe = pca.inverse_transform(Xd)

In [52]: print Xe.shape
(256, 784)
The following is a comparison of the original and the result of dimension compression. The upper row is the original, and the lower row is the dimension compressed. Since the number of dimensions was 50, it is difficult to see the difference, but you can see that it is slightly different.

The result of setting the number of dimensions to 3 is as follows. The result of dimensional compression has an extremely small number of dimensions, so small changes cannot be expressed and everyone feels the same.

I pasted the code I used below.
code
import numpy as np
import matplotlib.pyplot as plt

# generate data
x = np.linspace(0.2,1,100)
y = 0.8*x + np.random.randn(100)*0.1
X = np.vstack([x, y]).T
np.random.shuffle(X)

# plot data
fig = plt.figure()
axes = fig.add_subplot(111,aspect='equal')
axes.scatter(X[:,0],X[:,1])
axes.set_xlim([-0.2, 1.4])
axes.set_ylim([-0.2, 1.4])
axes.set_xlabel('x0')
axes.set_ylabel('x1')
axes.vlines(0,-0.2,1.4,linestyles='dashed')
axes.hlines(0,-0.2,1.4,linestyles='dashed')

# PCA
from sklearn.decomposition import PCA
pca = PCA(n_components=2)
pca.fit(X)

# print components and mean
print 'components'
print pca.components_
print 'mean'
print pca.mean_
print 'covariance'
print pca.get_covariance()

mn = np.mean(X,axis=0)
z = X - mn
cv = np.cov(z[:,0],z[:,1],bias=1)
print 'mean'
print mn
print 'covariance'
print cv

W, v = np.linalg.eig(cv)
print 'eigenvector'
print v
print 'eigenvalue'
print W

# covariance matrix x eigenvector
print cv.dot(v[:,0].reshape(2,1))
print v[:,0]*W[0]
print cv.dot(v[:,1].reshape(2,1))
print v[:,1]*W[1]
# display
fig = plt.figure()
axes = fig.add_subplot(111,aspect='equal')
axes.scatter(X[:,0],X[:,1])
axes.set_xlim([-0.2, 1.4])
axes.set_ylim([-0.2, 1.4])
axes.set_xlabel('x0')
axes.set_ylabel('x1')
axes.vlines(0,-0.2,1.4,linestyles='dashed')
axes.hlines(0,-0.2,1.4,linestyles='dashed')
axes.quiver(pca.mean_[0], pca.mean_[1], pca.components_[0,0],pca.components_[0,1], color='red', width=0.01, scale=3)
axes.quiver(pca.mean_[0], pca.mean_[1], pca.components_[1,0],pca.components_[1,1], color='blue', width=0.01, scale=3)

# projection
Xd = pca.transform(X)
print pca.components_[0]
print pca.components_[1]
print X[0,:]
print z[0,:]
print pca.components_[0].dot(z[0,:]), pca.components_[1].dot(z[0,:])
print Xd[0,:]

fig = plt.figure()
axes = fig.add_subplot(111,aspect='equal')
axes.scatter(Xd[:,0],Xd[:,1])
axes.set_xlabel('xd0')
axes.set_ylabel('xd1')
axes.set_xlim([-1.0, 1.0])
axes.set_ylim([-1.,1.0])
axes.vlines(0,-1.0,1.0,linestyles='dashed')
axes.hlines(0,-1.0,1.0,linestyles='dashed')
# MNIST
# generate data
import numpy as np
import matplotlib.pyplot as plt
import gzip
image_filename = './data/mnist/train-images-idx3-ubyte.gz'
label_filename = './data/mnist/train-labels-idx1-ubyte.gz'
def _read32(bytestream):
  dt = np.dtype(np.uint32).newbyteorder('>')
  return np.frombuffer(bytestream.read(4), dtype=dt)[0]

with gzip.open(image_filename) as bytestream:
    magic = _read32(bytestream)
    num_images = _read32(bytestream)
    rows = _read32(bytestream)
    cols = _read32(bytestream)
    buf = bytestream.read(rows * cols * num_images)
    data = np.frombuffer(buf, dtype=np.uint8)
    data = data.reshape(num_images, rows, cols)

with gzip.open(label_filename) as bytestream:
    magic = _read32(bytestream)
    num_items = _read32(bytestream)
    buf = bytestream.read(num_items)
    labels = np.frombuffer(buf, dtype=np.uint8)

Xall = data[labels == 3, :, :]
X = Xall[0:256,:,:].reshape(256,28*28)
X = X /255.0
# PCA
from sklearn.decomposition import PCA
N = 3
pca = PCA(n_components=N)
pca.fit(X)

# plot
import matplotlib.pyplot as plt
import matplotlib.cm as cm

cols = 10
rows = int(np.ceil(N/float(cols)))

fig, axes = plt.subplots(ncols=cols, nrows=rows, figsize=(20,10))

for i in range(N):
    r = i // cols
    c = i % cols
    axes[r, c].imshow(pca.components_[i].reshape(28,28),vmin=-0.5,vmax=0.5, cmap = cm.Greys_r)
    axes[r, c].set_title('component %d' % i)
    axes[r, c].get_xaxis().set_visible(False)
    axes[r, c].get_yaxis().set_visible(False)

# projection
Xd = pca.transform(X)
print X.shape
print Xd.shape

# inverse
Xe = pca.inverse_transform(Xd)
print Xe.shape


fig, axes = plt.subplots(ncols=10, nrows=2, figsize=(30,4))


for i in range(10):
    axes[0, i].imshow(X[i,:].reshape(28,28),vmin=0.0,vmax=1.0, cmap = cm.Greys_r)
    axes[0, i].set_title('original %d' % i)
    axes[0, i].get_xaxis().set_visible(False)
    axes[0, i].get_yaxis().set_visible(False)

    axes[1, i].imshow(Xe[i,:].reshape(28,28),vmin=0.0,vmax=1.0, cmap = cm.Greys_r)
    axes[1, i].set_title('dimension reduction %d' % i)
    axes[1, i].get_xaxis().set_visible(False)
    axes[1, i].get_yaxis().set_visible(False)
Recommended Posts