Order of arguments of RegularGridInterpolator and interp2d
It is a memorandum of crap.
I'm always confused by the order of the arguments of scipy.interpolate.RegularGridInterpolator and the grid specification, so I wrote the test code. The reason for the confusion is that scipy.interpolate.interp2d and so on seem to have a different order of arguments.
No, the argument for the grid of interp2d is two one-dimensional arrays, and the first argument of RegularGridInterpolator is a multidimensional array, right? If you say that things are different, that's right, and in the case of a multidimensional array, if x (l), y (m), z (n), the shape is (n, m, l). I have no words to return, but I just write it in reverse. <The procession is weak for a long time
So, if I shame this way, I'll make a mistake next time, praying and making a memorandum.
import numpy as np
from scipy.interpolate import RegularGridInterpolator
x_iter = np.array([0,1,2,3,4])
y_iter = np.array([5,6,7])
z_iter = np.array([8,9])
print("number of x_iter l = %d" % (len(x_iter)))
print("number of y_iter m = %d" % (len(y_iter)))
print("number of z_iter n = %d" % (len(z_iter)))
def data_func(x, y, z) :
return x + y*10 + z*100
data = []
for z in z_iter :
buf2 = []
for y in y_iter :
buf = []
for x in x_iter :
buf.append(data_func(x, y, z))
buf2.append(buf)
data.append(buf2)
data = np.array(data)
print("data", data)
print("shape of data, n x m x l array", data.shape)
data_grid = tuple([z_iter, y_iter, x_iter])
print("data grid with a format tuple(z_iter, y_iter, x_iter) is", data_grid)
f = RegularGridInterpolator(data_grid, data)
point_of_interest = tuple([8.3, 5.5, 1.1])
print("point_of_interest with a format tuple(z, y, x) is", point_of_interest)
interp_value = f(point_of_interest)
print("interpolated value is", interp_value)
import matplotlib
matplotlib.use("Agg")
import matplotlib.pyplot as plt
from matplotlib import colors
figid = 1
plt.figure(figid)
ax1 = plt.subplot(1, 1, 1)
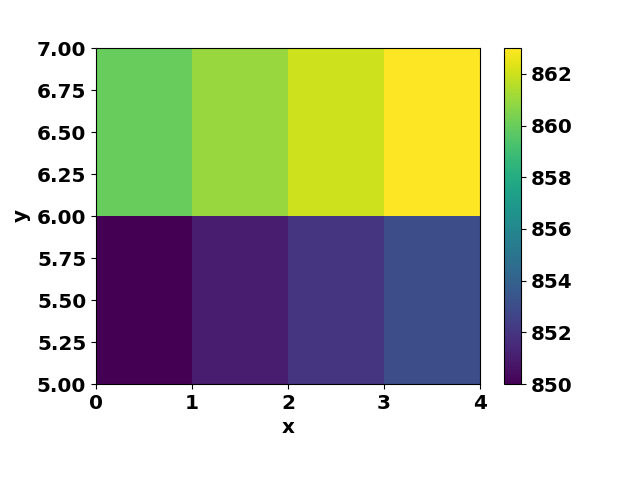
xx, yy = np.meshgrid(x_iter, y_iter)
data_2D = data[0, :, :]
print("shape of data_2D for z_bin = 0", data_2D.shape)
phist = ax1.pcolormesh(xx, yy, data_2D, norm=colors.Normalize())
plt.colorbar(phist)
ax1.set_ylabel("y")
ax1.set_xlabel("x")
plt.savefig("interp_test.png ")
When creating data while turning with for, pay attention to the order of turning. In Default, if you specify a value outside the range for the x, y, z values, an error will occur. This behavior can be controlled with the bounds_error argument and the fill_value variable (default is bounds_error = True, fill_value = nan)
By the way, when using scipy.interpolation.interp2D, it looks like this. By Default, if you specify a value outside the range for the x and y values, you will not die (returns the end value in the data table). This behavior can be controlled with the bounds_error argument and the fill_value variable (default is bounds_error = False, fill_value = None)
import numpy as np
from scipy.interpolate import interp2d

x_iter = np.array([0,1,2,3,4])
y_iter = np.array([5,6,7])
print("number of x_iter l = %d" % (len(x_iter)))
print("number of y_iter m = %d" % (len(y_iter)))

def data_func(x, y) :
    return x + y*10

data = []
for y in y_iter :
    buf = []
    for x in x_iter :
        buf.append(data_func(x, y))
    data.append(buf)

data = np.array(data)
print("data", data)
print("shape of data, m x l array", data.shape)

# order of arguments: x-axis, y-axis, data
f = interp2d(x_iter, y_iter, data)

x = 1.5
y = 5.5
print("datapoint is (%f, %f), data_func(%f, %f) is %f" % (x, y, x, y, data_func(x, y)))
interp_value = f(x, y)
print("interpolated value is", interp_value)

# test2 : what happens if x1 is out of range?
x1 = 7 # x-range is (0, 4)
y1 = 10 # y-range is (5, 7)
print("datapoint is (%f, %f), data_func(%f, %f) is %f" % (x1, y1, x1, y1, data_func(x1, y1)))
interp_value = f(x1, y1)
print("interpolated value is", interp_value)
# this value is
print("interpolated value for (%f, %f) is %f" % (x_iter[-1], y_iter[-1], f(x_iter[-1], y_iter[-1])))

import matplotlib
matplotlib.use("Agg")
import matplotlib.pyplot as plt
from matplotlib import colors

figid = 1
plt.figure(figid)
ax1 = plt.subplot(1, 1, 1)
xx, yy = np.meshgrid(x_iter, y_iter)

phist = ax1.pcolormesh(xx, yy, data, norm=colors.Normalize())
plt.colorbar(phist)
ax1.set_ylabel("y")
ax1.set_xlabel("x")
plt.savefig("interp_test2D.png ")
Recommended Posts