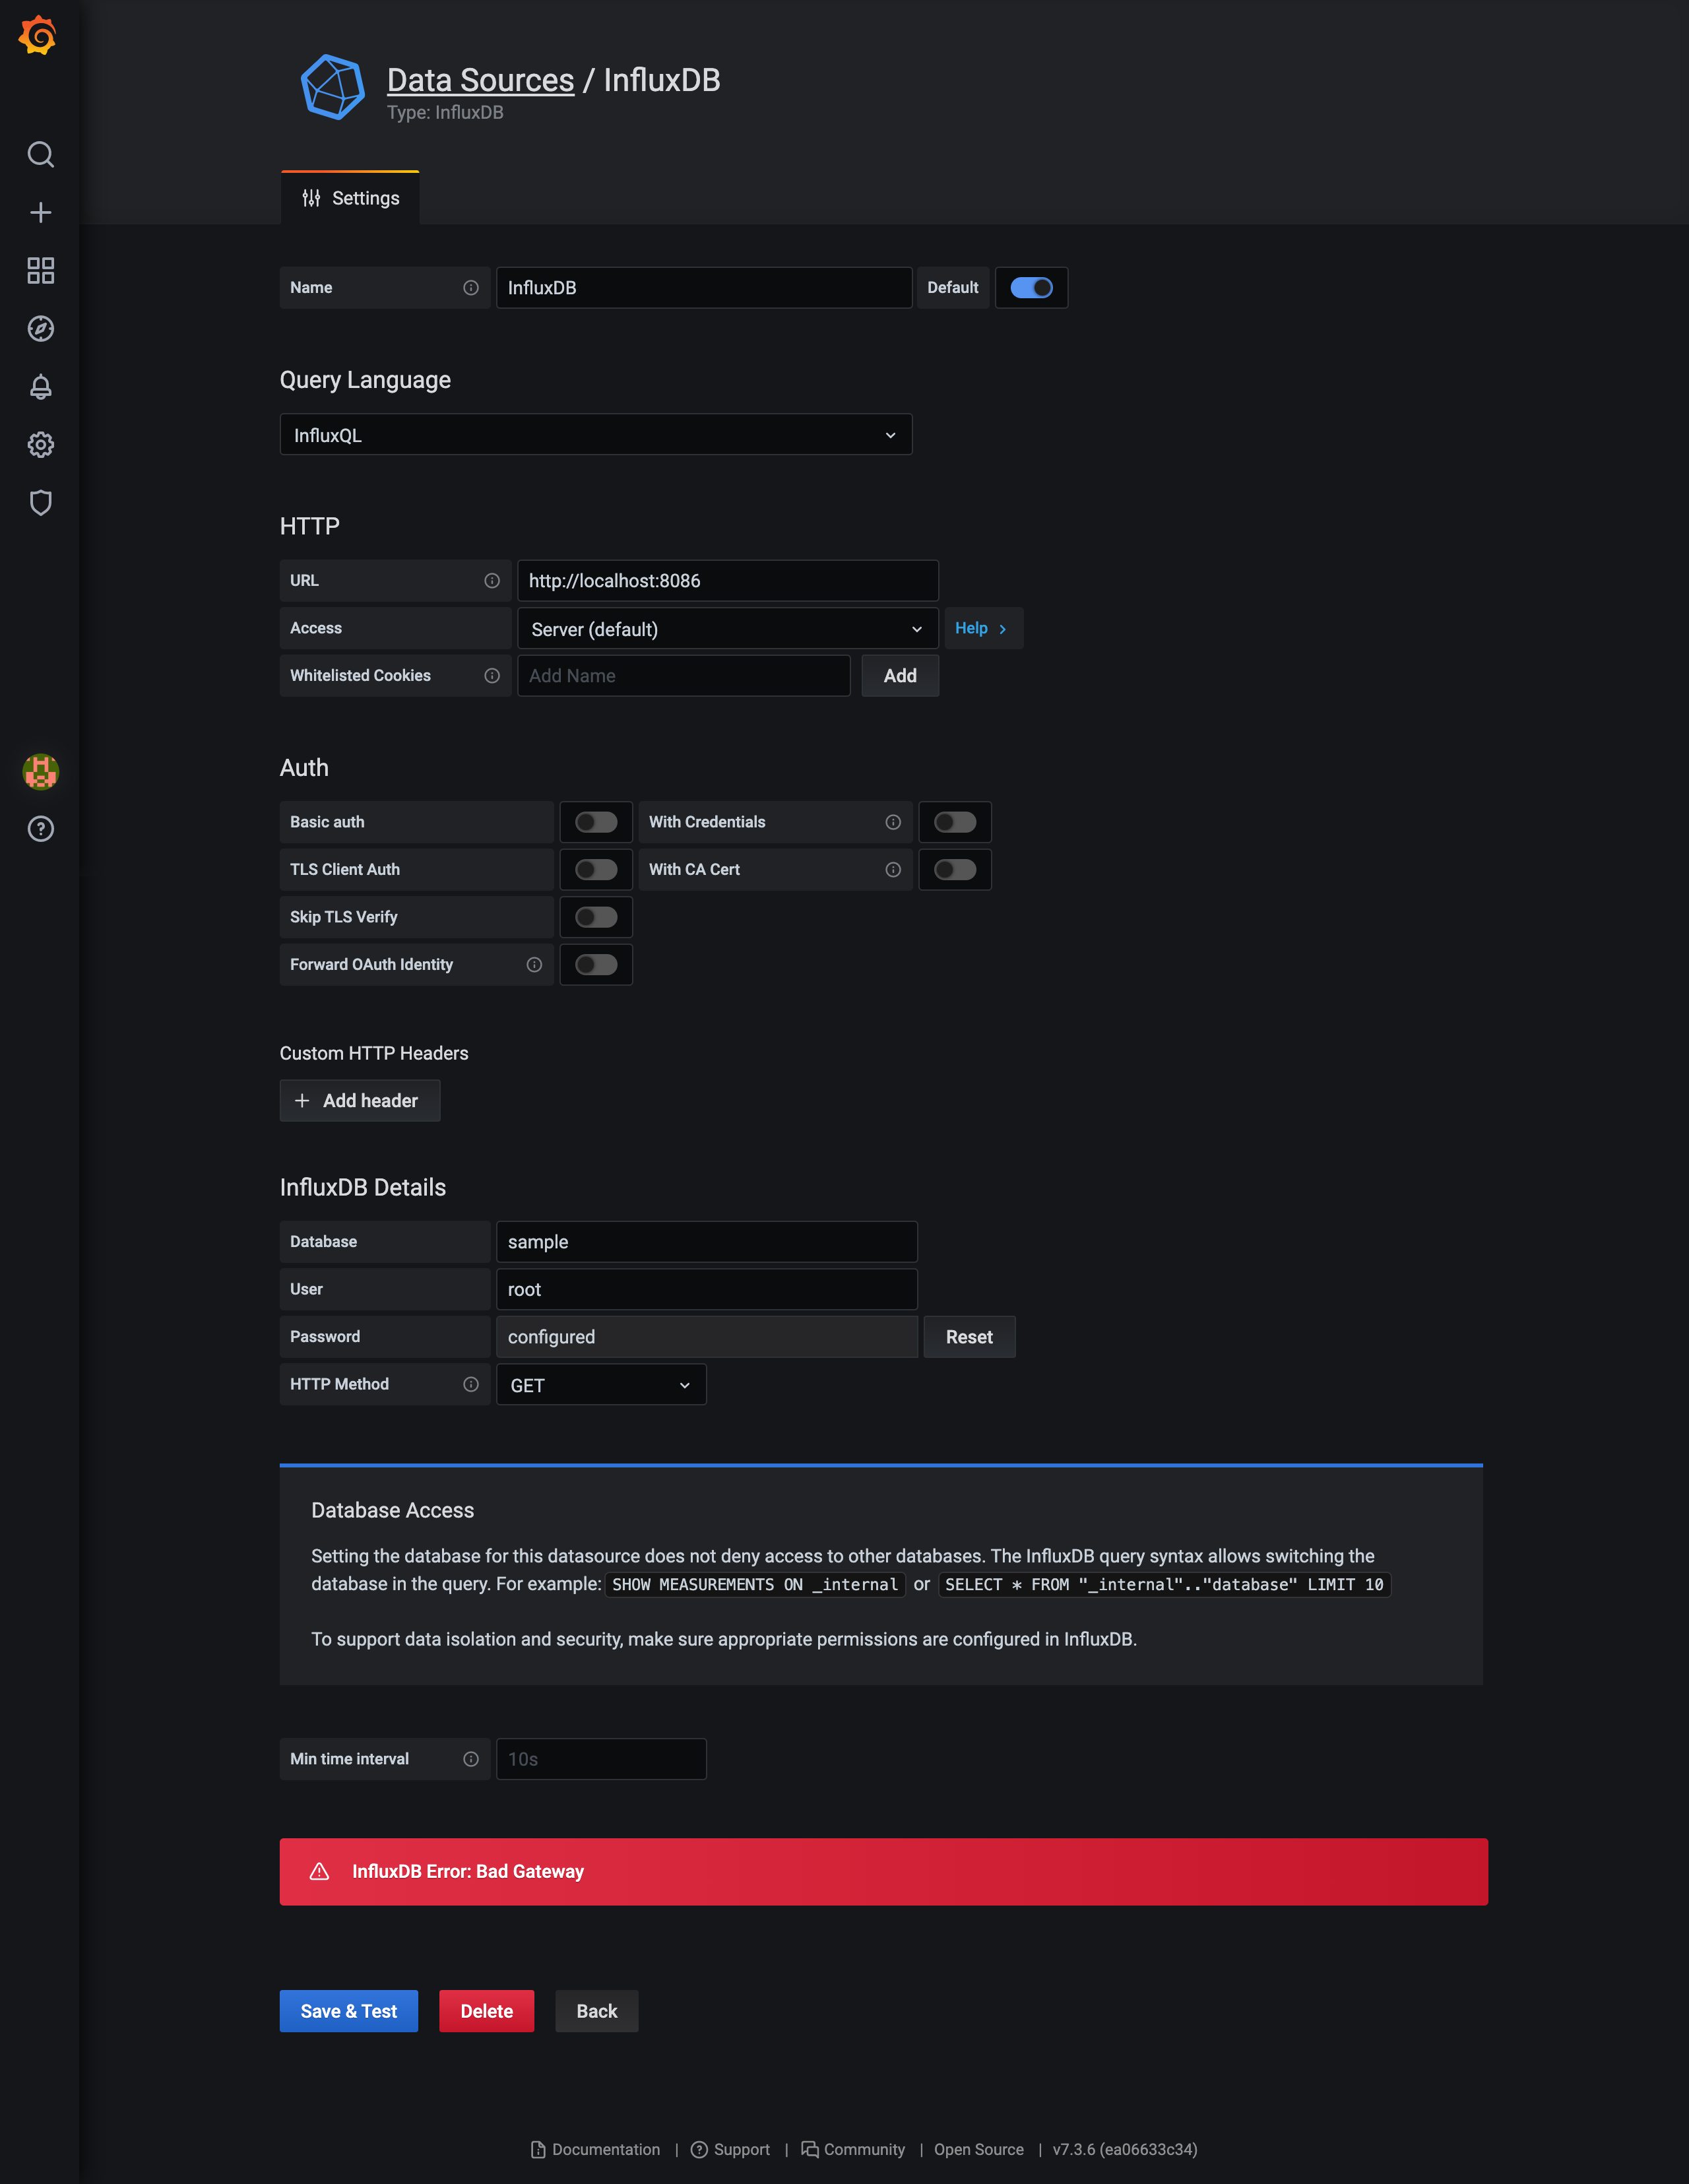
Bad Gateway came out when I tried to connect Grafana and InfluxDB on Docker

When I tried the tutorial that came out by googled "Grafana InfluxDB Docker", the story that was troubled by the above Bad Gateway. The bottom line was that I didn't understand the combination of URL and Access correctly.
Implementation environment
I launched a Grafana and InfluxDB container on Docker on my local PC and tried to configure InflxDB from Grafana's Data Sources. Write the following Docker-compose.yml and execute it.
version: "3"
services:
  influxdb:
    image: influxdb:latest
    ports:
      - "8086:8086"
    volumes:
      - ./data/influxdb:/var/lib/influxdb

  grafana:
    image: grafana/grafana:latest
    ports:
      - "3000:3000"
    volumes:
      - ./data/grafana:/var/lib/grafana
    depends_on:
      - influxdb
I like volumes for feasibility, but this time I will create a "data" folder in the same hierarchy as docker-compose.yml, and create an "influxdb" folder and a "grafana" folder under it.
Access InfluxDB with docker command, create a new database (sample in this case) and measurement, then access Grafana with " http: // localhost: 3000 " and Data Sources of Configuration When I entered the information to add more InfluxDB and even executed "Save & Test", the "InfluxDB Error: Bad Gateway" as shown at the beginning occurred.
Solution (1) Change Access from Server to Browser (not recommended)
This is the solution that I was able to connect while playing with various settings.
If you understand the meaning after that, this ① is deprecated and you should carry out ② described later, so it is only for reference.
 If you want to establish a connection with the URL
 " https: // localhost: 8086 ", change Access from " Server " to " Browser " after" Save & Test ". , "Data source is working" and now connected.
By the way, what is this Access?
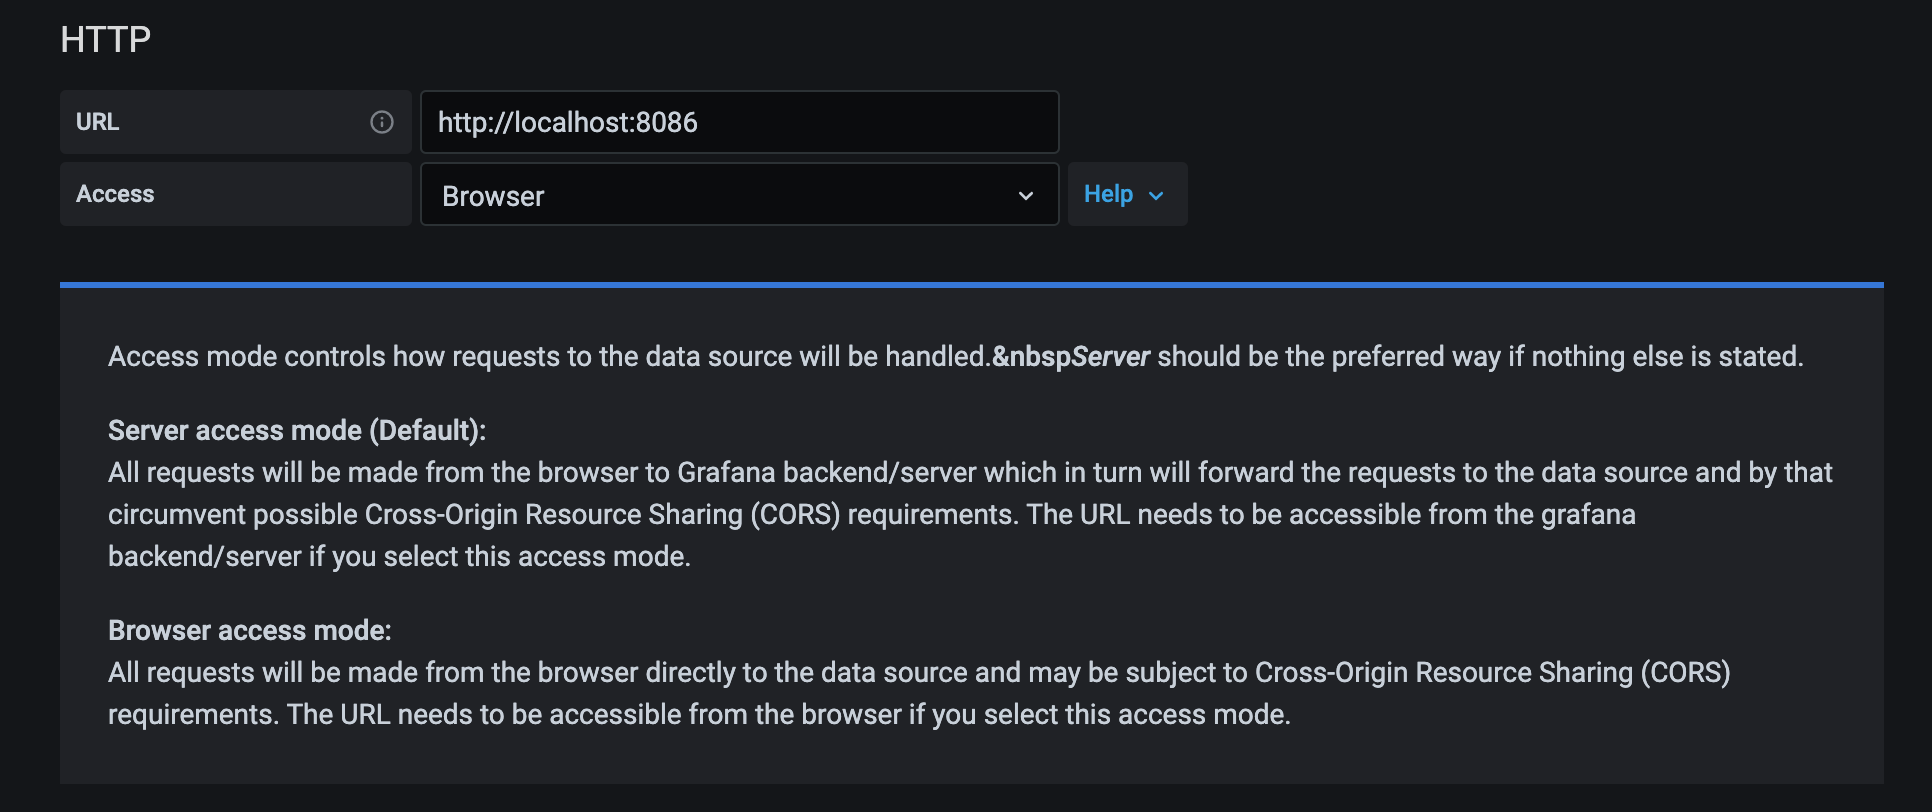
If you select "Help" on the right, the following description will be displayed.
 In summary, I understand that:
-** Server ** attempts access via Grafana's backend (internal communication)
-** Browser ** tries to access directly from the browser (external communication)
In other words, the reason I stumbled this time is that the URL is "localhost: 8086" when ** Server **, so ** I tried to access the 8086 port on the Grafana container **, so Bad Gateway occurred. It will be.
However, in solution (1), localhost (local PC itself) is now accessed as external communication instead of internal communication, so it is possible to connect. However, in actual cases, there are almost no cases where the database layer like InfluxDB can be accessed from the outside, and it is desirable to be able to access the DB by internal communication.
Therefore, this time, I made it accessible with the following solution.
Solution (2) Change the URL to a name (address) for internal communication
This time, since the Grafana container and InfluxDB container are started from Docker compose, it depends on the description of docker-compose.yml and the directory name, but this time it will be in the following state as an example.
 $ docker-compose ps
           Name                      Command           State           Ports
-------------------------------------------------------------------------------------
influxdb_grafana_grafana_1    /run.sh                  Up      0.0.0.0:3000->3000/tcp
influxdb_grafana_influxdb_1   /entrypoint.sh influxd   Up      0.0.0.0:8086->8086/tcp
In the above case, the container name of InfluxDB will be "influxdb_grafana_influxdb_1".
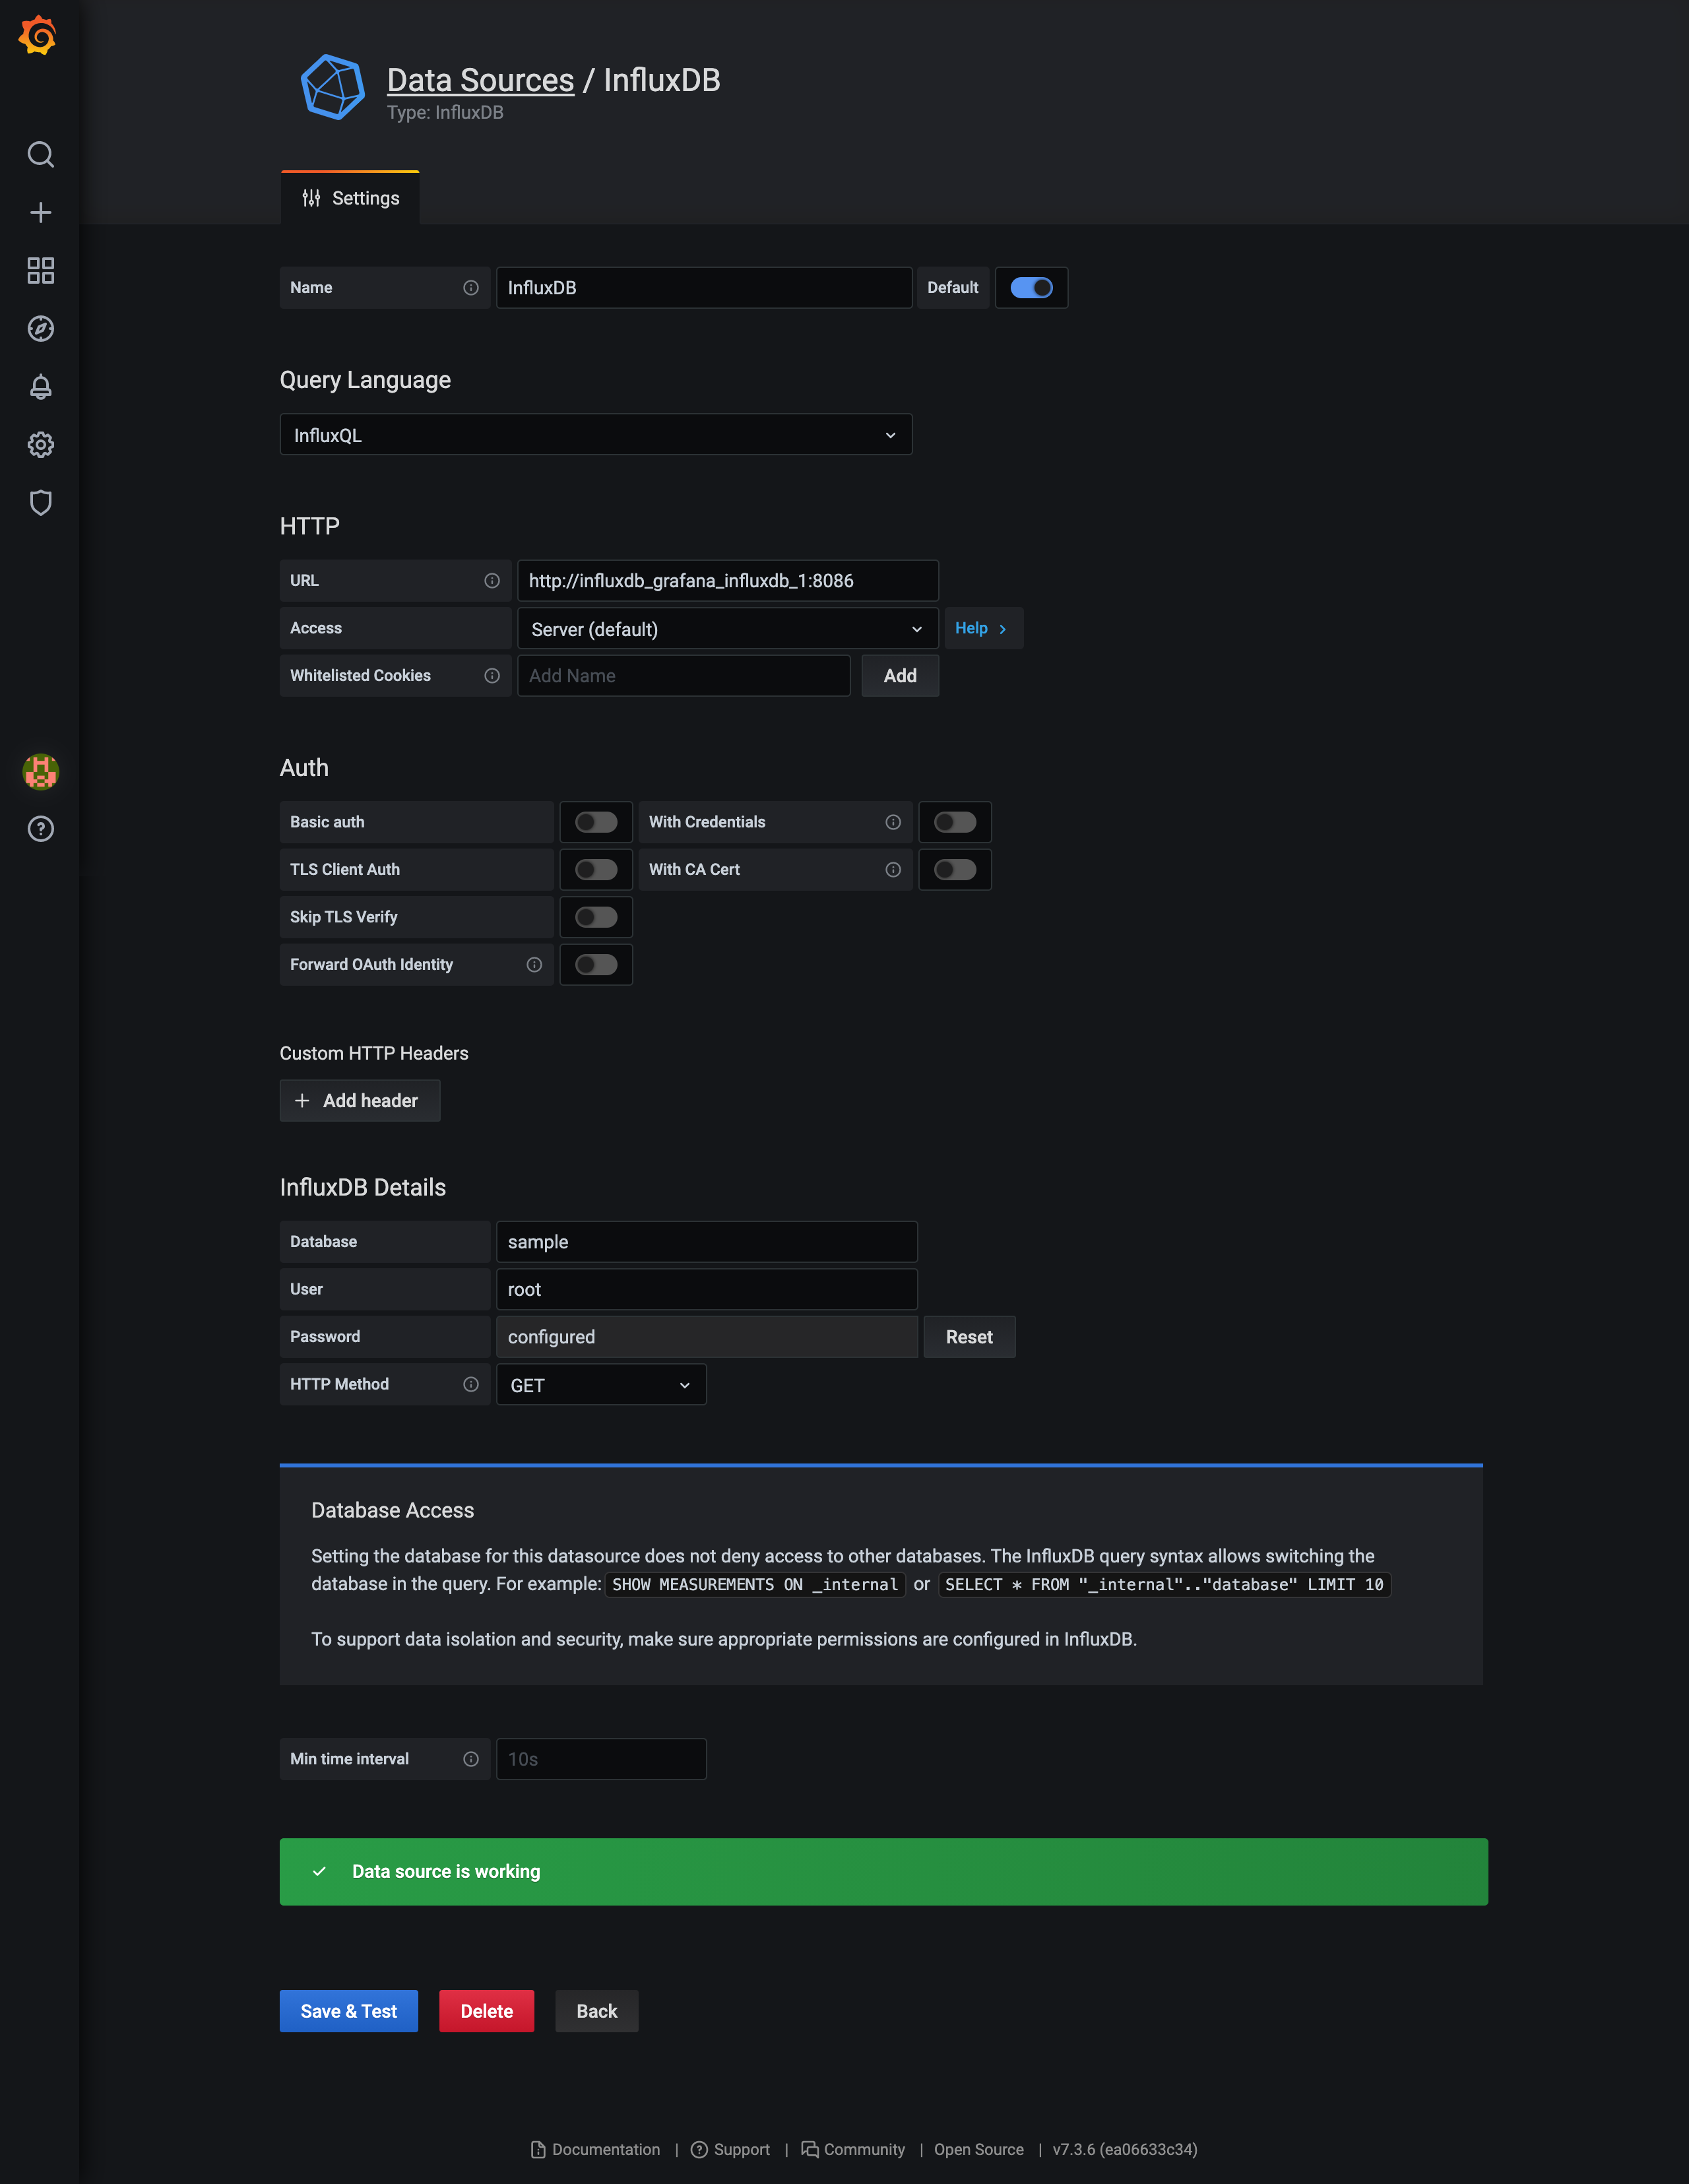
In docker-compose, name resolution can be done by default with each other's container name from network, so by using this "influxdb_grafana_influxdb_1" as the URL name, Access will be able to connect even with ** Server **.
In this example, the URL is http: // influxdb_grafana_influxdb_1: 8086.

Recommended Posts