Why not create a stylish table easily with Python?
Python is convenient
Python is convenient. Graphs can be easily created with matplotlib, and numerical calculations need only be done with numpy. Recently, Python is used for machine learning research and can even make games.
At that time, I suddenly wondered, "Can I make diagrams with Python, but can I also make tables?"
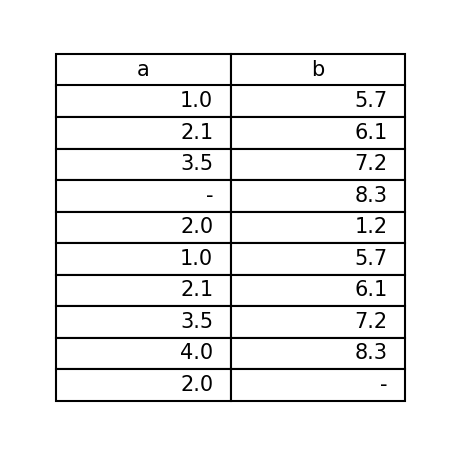
matplotlib The answer was here. Apparently matplotlib has a function to create a table. If you write it, it looks like this.
import matplotlib.pyplot as plt
import pandas as pd


if __name__ == '__main__':
    data = {
        'a': [1.0, 2.1, 3.5, '-', 2.0, 1.0, 2.1, 3.5, 4.0, 2.0, ],
        'b': [5.7, 6.1, 7.2, 8.3, 1.2, 5.7, 6.1, 7.2, 8.3, '-', ],
        }

    df = pd.DataFrame(data)

    fig, ax = plt.subplots(figsize=(3, 3))

    ax.axis('off')
    ax.axis('tight')

    ax.table(cellText=df.values,
             colLabels=df.columns,
             bbox=[0, 0, 1, 1],
             )

    plt.show()

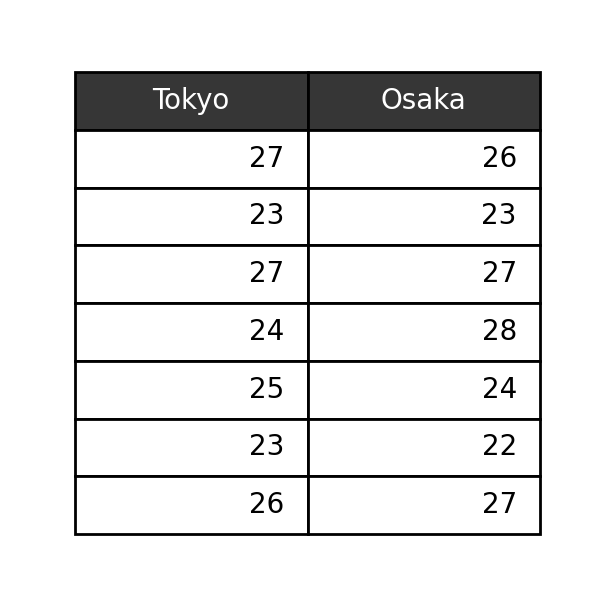
It is a little troublesome to make a table, and it is not easy to change the design of the table. To change the design
import matplotlib.pyplot as plt
import pandas as pd


if __name__ == '__main__':
    data = {
        'Tokyo': [27, 23, 27, 24, 25, 23, 26],
        'Osaka': [26, 23, 27, 28, 24, 22, 27],
    }

    df = pd.DataFrame(data)

    fig, ax = plt.subplots(figsize=(3, 3))

    ax.axis('off')
    ax.axis('tight')

    tb = ax.table(cellText=df.values,
                  colLabels=df.columns,
                  bbox=[0, 0, 1, 1],
                  )

    tb[0, 0].set_facecolor('#363636')
    tb[0, 1].set_facecolor('#363636')
    tb[0, 0].set_text_props(color='w')
    tb[0, 1].set_text_props(color='w')

    plt.show()
It needs to be like this.

It's a bit deliberate, but it's a hassle if you're elaborate on the design.
So, based on this ** matplotlib table function, let's create a library that can easily create stylish tables **.
I also wanted to try PyPI, so I also tried to do pip install.
pyTable It's a simple name, but I created it for the time being. Of course, it is already registered on PyPI, so
$ pip install pytab
It can be installed with. I really wanted to make it ** pytable **, but I compromised because I had a previous contract. (I want you to delete it from PyPI, the one that hasn't been updated for a while.)
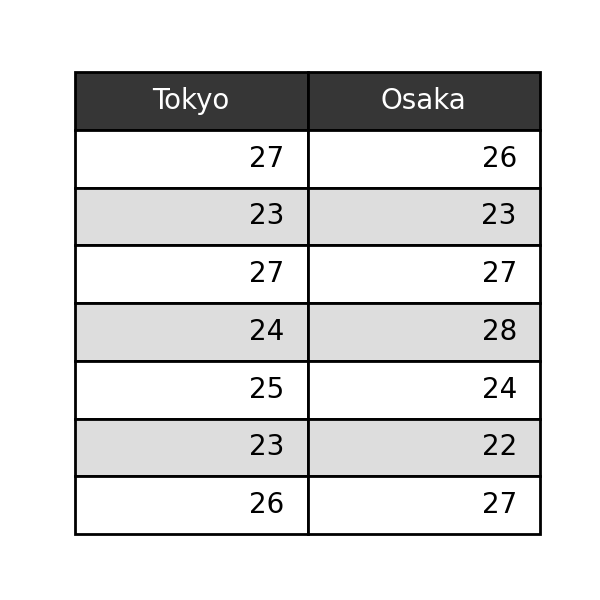
Then, you can create a simple and stylish table by specifying the arguments as shown below.
import pytab as pt


if __name__ == '__main__':
    data = {
        'Tokyo': [27, 23, 27, 24, 25, 23, 26],
        'Osaka': [26, 23, 27, 28, 24, 22, 27],
    }

    pt.table(
        data=data,
        th_type='dark',
        table_type='striped'
    )

    pt.show()

Other detailed tables can be defined, but a simple document is summarized below, so if you are interested, please have a look. pyTable documentation
Source Github: HiroshiARAKI/pytable: pytable is the library to plot table easily. PyPI: pytab · PyPI
Afterword
As you can see from the source code, I haven't written such a big code. With this, I think that ** library ** can often be called so proudly. You just wrapped matplotlib! I can't argue with that. Lol
Well, it's still a developing library, so we plan to make it even more convenient in the future (probably). If you are interested, please use ** pyTable !! **
Recommended Posts