[pyqtgraph] Created a class to display the crosshairs that follow the cursor and their coordinates
What you want to do
Creating a class that does this
--Creating a crosshair that follows the cursor --Display x, y coordinates on the label --Label color will be the same as the plot line --None display if out of y-axis range

environment
Mac OS Python 3.8.5
PyQt5 5.15.2 PyQt5-sip 12.8.1 pyqtgraph 0.11.1
pip install PyQt5 PyQt5-sip pyqtgraph
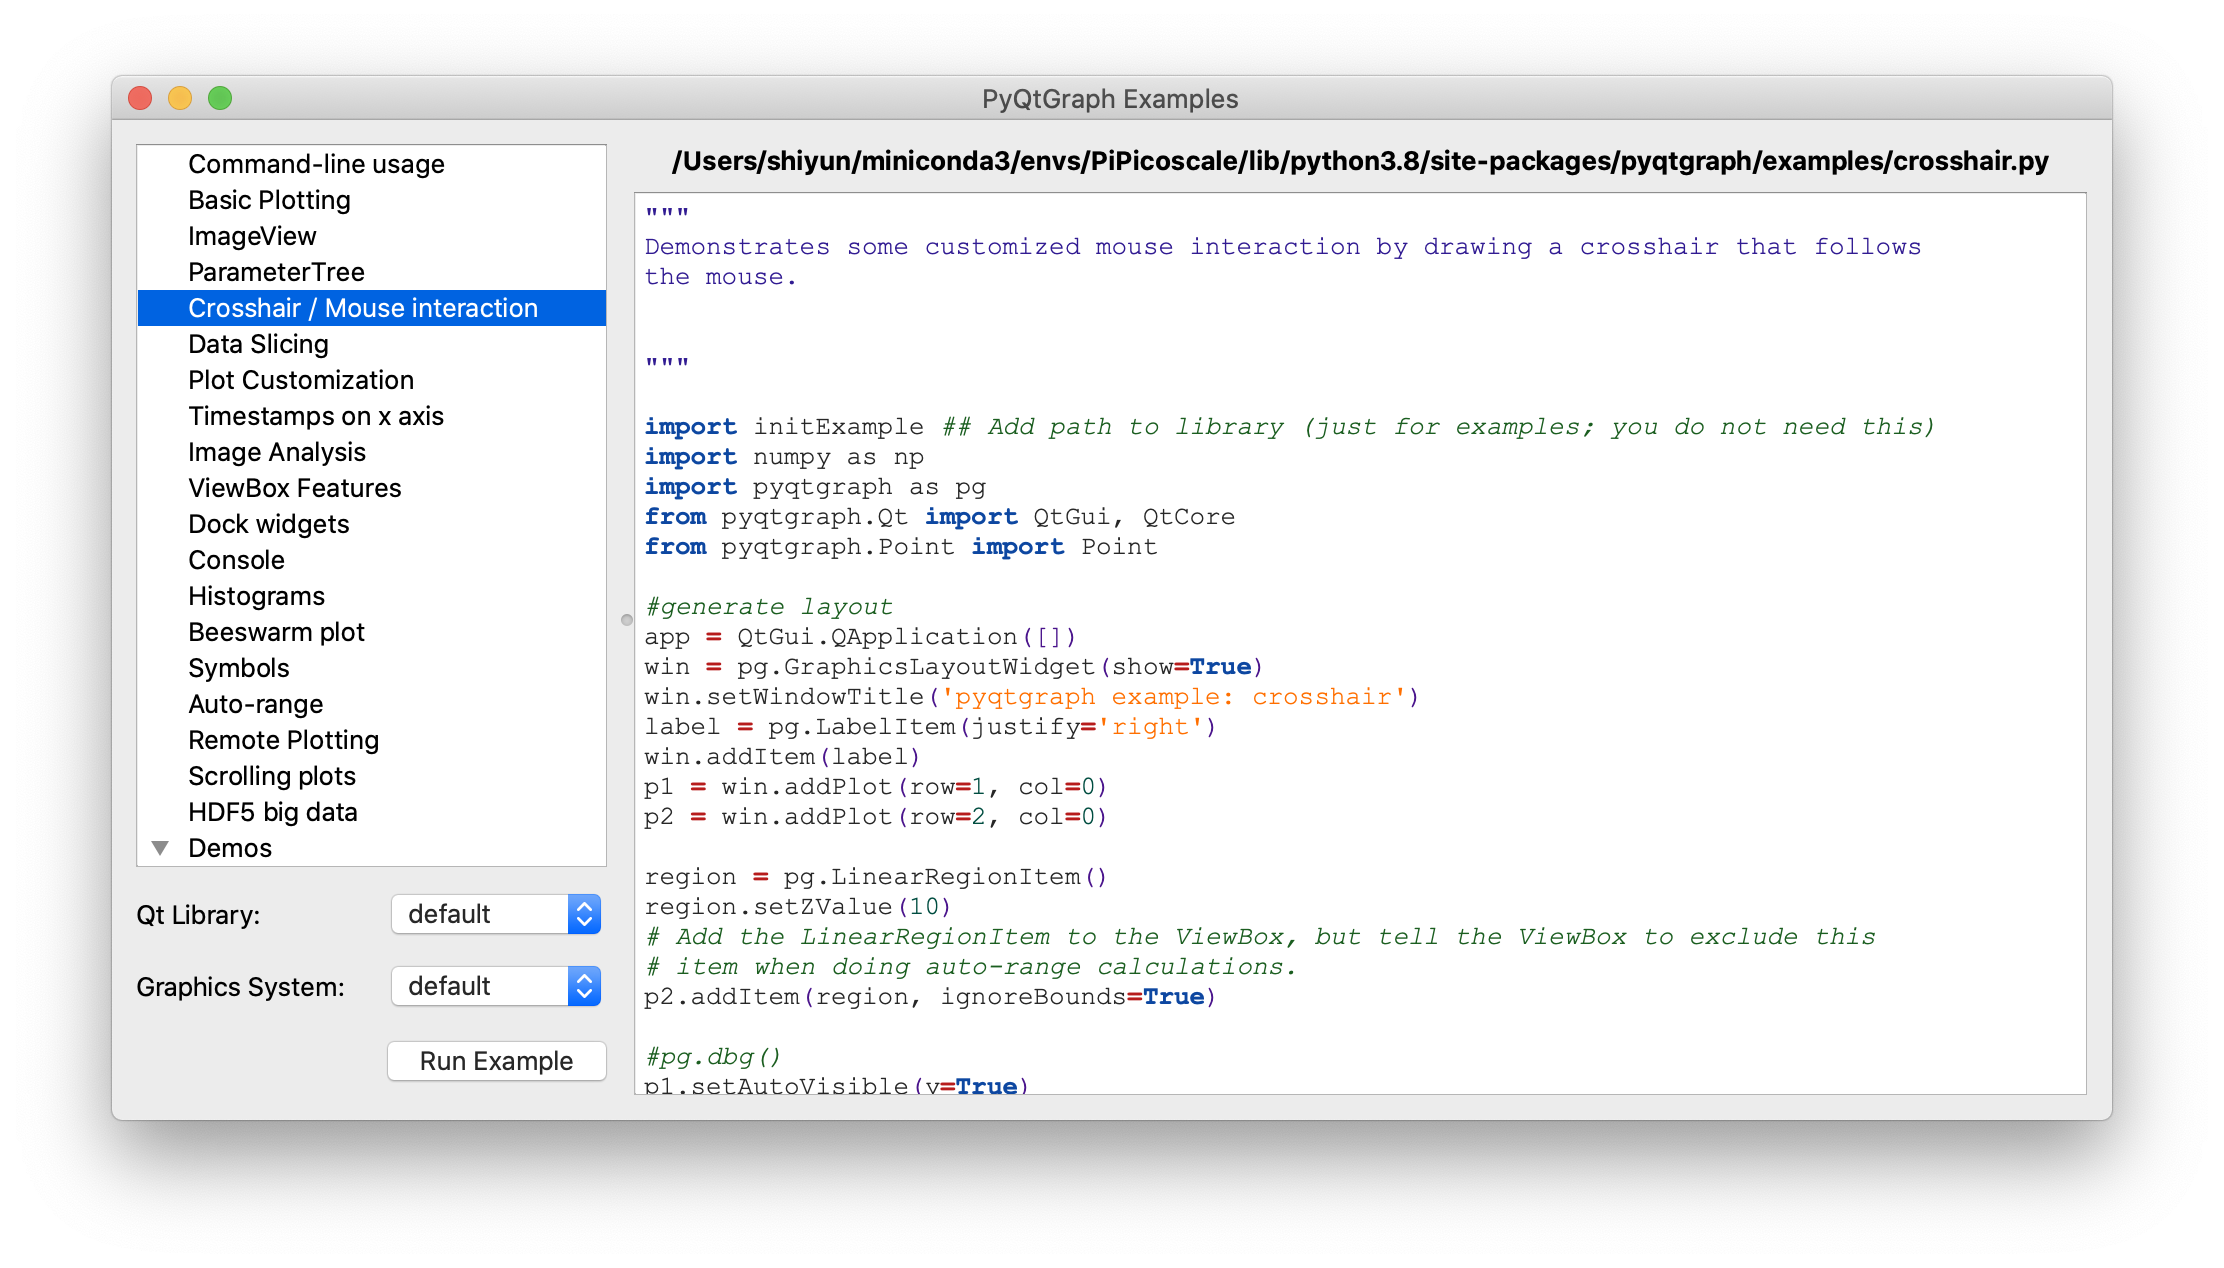
pyqtgraph.exsamples
import pyqtgraph.examples as ex
ex.run()
You can see various sample graphs at. I referred to Crosshair / Mouse interaction this time.
What I made
import dataclasses
from typing import Union
import sys
from PyQt5 import QtWidgets
import pyqtgraph as pg
@dataclasses.dataclass
class CursorCrossHairLabel(object):
"""A class that creates a crosshair that follows the cursor and adds it to the graph
Display coordinates if the cursor is within coordinates
Attributes #
----------
plotter: pg.PlotItem
Graph to add a crosshair
label: pg.LabelItem
Label displaying coordinates
vertical_line: pg.InfiniteLine
Vertical line chasing the cursor
horizontal_line: pg.InfiniteLine
Horizontal line chasing the cursor
proxy: pg.SignalProxy
self.cursor_Object that controls the execution interval of moved
y_label: str default='y'
string of y-value legend
label_font_size: Union[int, float] default=14
Label font size
digit :int default=3
Specify display of coordinates after the decimal point
Examples
----------
import dataclasses
from typing import Union
import sys
from PyQt5 import QtWidgets
import pyqtgraph as pg
app = QtWidgets.QApplication(sys.argv)
graph_widget = pg.GraphicsLayoutWidget()
label = pg.LabelItem(justify='right')
graph_widget.addItem(label)
plotter = graph_widget.addPlot(row=0, col=0)
plotter.showGrid(x=True, y=True, alpha=1)
curve1 = pg.PlotCurveItem([i ** 2 for i in range(10)], pen=pg.mkPen('#f00'))
curve2= pg.PlotCurveItem([2*i ** 2 for i in range(10)], pen=pg.mkPen('#0f0'))
plotter.addItem(curve1)
plotter.addItem(curve2)
cross_hair = CursorCrossHairLabel(plotter, label)
graph_widget.show()
sys.exit(app.exec_())
"""
plotter: pg.PlotItem
label: pg.LabelItem
y_label: str = 'y'
label_font_size: Union[int, float] = 14
digit: int = 3
v_color: dataclasses.InitVar[str] = '#ffd700'
v_width: dataclasses.InitVar[Union[int, float]] = 2
h_color: dataclasses.InitVar[str] = '#ffd700'
h_width: dataclasses.InitVar[Union[int, float]] = 2
def __post_init__(self, v_color: str, v_width: Union[int, float], h_color: str, h_width: Union[int, float]) -> None:
"""Continuation of constructor
Parameters
----------
v_color: str default='#ffd700'
Vertical line color
v_width: Union[int, float] default=2
Vertical line width
h_color: str default='#ffd700'
Horizontal line color
h_width: Union[int, float] default=2
Horizontal line width
"""
self.vertical_line = pg.InfiniteLine(angle=90, movable=False, pen=pg.mkPen(v_color, width=v_width))
self.horizontal_line = pg.InfiniteLine(angle=0, movable=False, pen=pg.mkPen(h_color, width=h_width))
#Added to plotter
self.plotter.addItem(self.vertical_line, ignoreBounds=True)
self.plotter.addItem(self.horizontal_line, ignoreBounds=True)
self.proxy = pg.SignalProxy(self.plotter.scene().sigMouseMoved, rateLimit=60, slot=self.cursor_moved)
self.set_label()
def set_label(self):
"""Initial values of coordinates(None)Set on the label"""
coord_text = f"<span style='font-size: {self.label_font_size}pt'>x=None<br>"
for y_index, curve in enumerate(self.plotter.curves, 1):
curve_color: str = curve.opts['pen'].color().name()
coord_text += f" <span style='color: {curve_color}'>{self.y_label}{y_index}=None</span><br>"
self.label.setText(coord_text)
def cursor_moved(self, window_coord) -> None:
"""Crosshair movement and coordinates are displayed at the cursor position
Display x value if the cursor coordinates are in the graph
If there is data in the y coordinate of the cursor, the y value is displayed. If it is out of range, None is displayed.
y coordinate label is the same color as curve
Parameters
----------
window_coord: tuple
Screen pixel coordinates, ex) (PyQt5.QtCore.QPointF(2.0, 44.0),)
Notes
----------
curve is pyqt graph.PlotCurveItem()If you do not create it with curve_An error occurs at the color part
ex) OK
import pyqtgraph as pg
window = pg.PlotWidget()
curve = pg.PlotCurveItem(pen=pg.mkPen('#ff0000))
window.addItem(curve)
ex) Error
import pyqtgraph as pg
window = pg.PlotWidget()
curve = window.plot(pen=...)
Description of variables in function===================
pos: PyQt5.QtCore.QPointF
In-screen coordinates of the cursor ex) PyQt5.QtCore.QPointF(2.0, 44.0)
cursor_point: QtCore.QPointF
Coordinates in the cursor graph ex) PyQt5.QtCore.QPointF(269.0678171506131, 0.695852534562212)
self.plotter.curves: List[pg.PlotCurveItem]
List of curves in plotter ex) [<pg.PlotCurveItem object at ...>, ...]
curve_color: str
curve color ex) '#ff0000',It doesn't matter but curve.opts['pen'].color()Type is Qt Gui.QColor
=================================
"""
pos = window_coord[0]
if self.plotter.sceneBoundingRect().contains(pos):
cursor_point = self.plotter.vb.mapSceneToView(pos)
x_cursor_point: float = cursor_point.x()
coord_text = f"<span style='font-size: {self.label_font_size}pt'>x={x_cursor_point:.{self.digit}f}<br>"
data_index = int(x_cursor_point)
for label_index, curve in enumerate(self.plotter.curves, 1):
curve_color = curve.opts['pen'].color().name()
if len(curve.yData) != 0 and 0 <= data_index < len(curve.yData):
y_value = curve.yData[data_index]
coord_text += f" <span style='color: {curve_color}'>" \
f"{self.y_label}{label_index}={y_value:.{self.digit}f}</span><br>"
else:
coord_text += f" <span style='color: {curve_color}'>{self.y_label}{label_index}=None</span><br>"
self.label.setText(coord_text)
#Cross line movement
self.vertical_line.setPos(cursor_point.x())
self.horizontal_line.setPos(cursor_point.y())
argument
Required arguments
--plotter: pyqtgraph.PlotItem, a graph that displays a crosshair --label: pyqtgraph.LabelItem, label to display coordinates
Other
--y_label: str, change legend character for y value, default ='y' --label_font_size: Union [int, float], label font size, default = 14 --digit: int Specify decimal point display of coordinates, default = 3
Also, the color and width of the cross line
Example of use
The execution result is the above gif
import dataclasses
from typing import Union
import sys

import numpy as np
from PyQt5 import QtWidgets
import pyqtgraph as pg

app = QtWidgets.QApplication(sys.argv)

graph_widget = pg.GraphicsLayoutWidget()

label = pg.LabelItem(justify='right')
graph_widget.addItem(label)

plotter = graph_widget.addPlot(row=0, col=0)
plotter.showGrid(x=True, y=True, alpha=1)

data = np.linspace(0, 100, 1000)

curve = pg.PlotCurveItem(data, pen=pg.mkPen('#f00', width=3))
curve2 = pg.PlotCurveItem(data * 2, pen=pg.mkPen('#0f0', width=3))
curve3 = pg.PlotCurveItem(data * 3, pen=pg.mkPen('#00f', width=3))
plotter.addItem(curve)
plotter.addItem(curve2)
plotter.addItem(curve3)
#this
cross_hair = CursorCrossHairLabel(plotter, label, y_label='sample', label_font_size=18)

graph_widget.show()
sys.exit(app.exec_())
When you don't want the label and graph to overlap

graph_widget = pg.GraphicsLayoutWidget()

plotter = graph_widget.addPlot()
plotter.showGrid(x=True, y=True, alpha=1)

label = pg.LabelItem(justify='right')
graph_widget.addItem(label)
Labelless ver
import dataclasses
from typing import Union
import sys

from PyQt5 import QtWidgets
import pyqtgraph as pg


@dataclasses.dataclass
class CursorCrossHair(object):
    """A class that creates a crosshair that follows the cursor and adds it to the graph
    Attributes #
    ----------
    plotter: pg.PlotItem
Graph to add a crosshair
    vertical_line: pg.InfiniteLine
Vertical line chasing the cursor
    horizontal_line: pg.InfiniteLine
Horizontal line chasing the cursor
    proxy: pg.SignalProxy
        self.cursor_Object that controls the execution interval of moved

    Examples
    ----------
    import dataclasses
    from typing import Union
    import sys

    from PyQt5 import QtWidgets
    import pyqtgraph as pg

    app = QtWidgets.QApplication(sys.argv)
    graph_widget = pg.GraphicsLayoutWidget()

    plotter = graph_widget.addPlot(row=0, col=0)
    plotter.showGrid(x=True, y=True, alpha=1)

    curve1 = pg.PlotCurveItem([i ** 2 for i in range(10)], pen=pg.mkPen('#f00'))
    curve2= pg.PlotCurveItem([2*i ** 2 for i in range(10)], pen=pg.mkPen('#0f0'))
    plotter.addItem(curve1)
    plotter.addItem(curve2)

    cross_hair = CursorCrossHair(plotter)

    graph_widget.show()
    sys.exit(app.exec_())
    """
    plotter: pg.PlotItem
    v_color: dataclasses.InitVar[str] = '#ffd700'
    v_width: dataclasses.InitVar[Union[int, float]] = 2
    h_color: dataclasses.InitVar[str] = '#ffd700'
    h_width: dataclasses.InitVar[Union[int, float]] = 2

    def __post_init__(self, v_color: str, v_width: Union[int, float], h_color: str, h_width: Union[int, float]) -> None:
        """Continuation of constructor
        Parameters
        ----------
        v_color: str default='#ffd700'
Vertical line color
        v_width: Union[int, float] default=2
Vertical line width
        h_color: str default='#ffd700'
Horizontal line color
        h_width: Union[int, float] default=2
Horizontal line width
        """
        self.vertical_line = pg.InfiniteLine(angle=90, movable=False, pen=pg.mkPen(v_color, width=v_width))
        self.horizontal_line = pg.InfiniteLine(angle=0, movable=False, pen=pg.mkPen(h_color, width=h_width))
        #Added to plotter
        self.plotter.addItem(self.vertical_line, ignoreBounds=True)
        self.plotter.addItem(self.horizontal_line, ignoreBounds=True)

        self.proxy = pg.SignalProxy(self.plotter.scene().sigMouseMoved, rateLimit=60, slot=self.cursor_moved)

    def cursor_moved(self, window_coord) -> None:
        """Move the crosshair to the cursor position
         Parameters
         ----------
         window_coord: tuple
Screen pixel coordinates, ex) (PyQt5.QtCore.QPointF(2.0, 44.0),)

         Notes
         ----------
Description of variables in function===================
         pos: PyQt5.QtCore.QPointF
In-screen coordinates of the cursor ex) PyQt5.QtCore.QPointF(2.0, 44.0)
         cursor_point: QtCore.QPointF
Coordinates in the cursor graph ex) PyQt5.QtCore.QPointF(269.0678171506131, 0.695852534562212)
         =================================
         """
        pos = window_coord[0]
        if self.plotter.sceneBoundingRect().contains(pos):
            cursor_point = self.plotter.vb.mapSceneToView(pos)
            self.vertical_line.setPos(cursor_point.x())
            self.horizontal_line.setPos(cursor_point.y())
Recommended Posts