Coursera Machine Learning Challenges in Python: ex1 (Linear Regression)
policy
Machine Learning at Stanford University, the most popular course on the online learning platform Coursera. The instructor is Dr. Andrew Ng. Classes consist of lectures and programming tasks, but Octave or Matlab is specified as the language used for the programming tasks.
We will quietly implement this programming task using Python. However,
- Since the original task is intended to help you understand the algorithm, some processes are designed to write your own code without using machine learning libraries. Instead of reproducing this in Python as it is, I want to implement it efficiently using the machine learning library in Python as much as possible.
The policy.
Ex1 at once
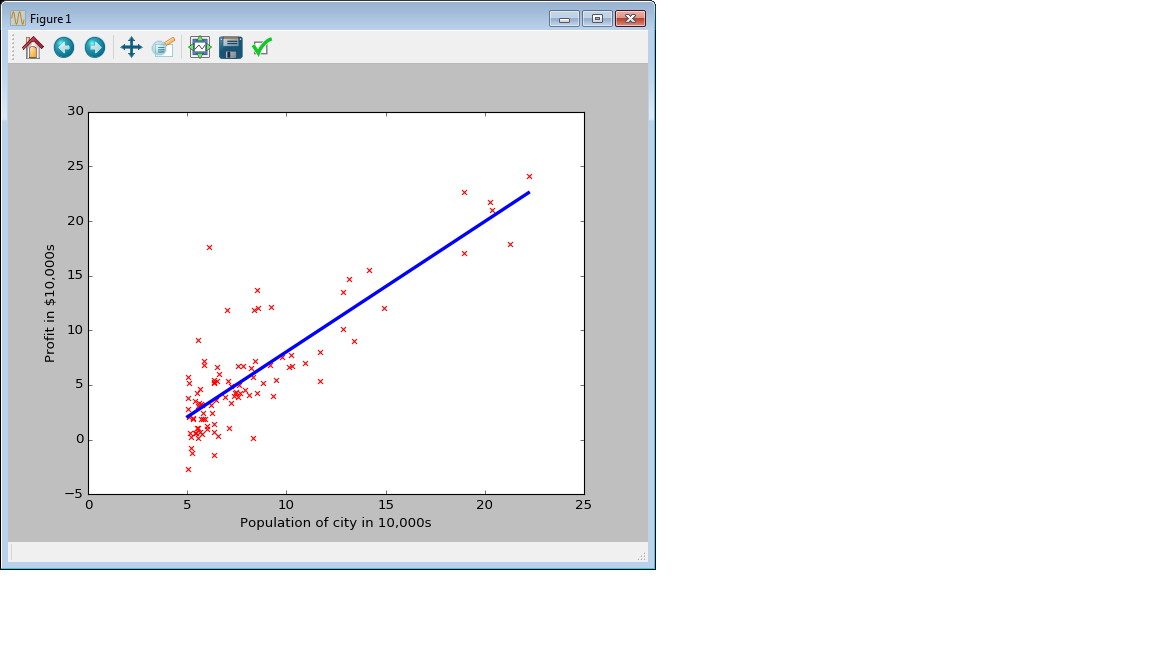
In ex1, which is the first task, we will do Linear Regression. In restaurant chain management, the profit amount when opening a new store is predicted based on the data set that pairs the population of the city that opened in the past and the profit amount of the restaurant.
Click here for the code.
ex1.py
import numpy as np
import pandas as pd
import matplotlib.pyplot as plt
from sklearn import linear_model

#Data read
data = pd.read_csv("ex1data1.txt", header=None)

plt.scatter(data[0], data[1], marker='x', c='r')
plt.xlabel("Population of city in 10,000s")
plt.ylabel("Profit in $10,000s")

X = np.array([data[0]]).T
y = np.array(data[1])

model = linear_model.LinearRegression()
model.fit(X, y)

px = np.arange(X.min(),X.max(),.01)[:,np.newaxis]
py = model.predict(px)

plt.plot(px, py, color="blue", linewidth=3)
plt.show()
The resulting plot is output like this:

This time's point
The linear regression model uses scikit-learn's sklearn.linear_model.LinearRegression () class. First, create an instance and train with model.fit (X, y). The intercept and slope that are the learning results can be extracted as model.intercept_ and model.coef_, respectively. To make a prediction for a new X value using a model, usemodel.predict (X).
About one-dimensional vector of numpy
Unlike Matlab / Octave, Python does not distinguish between one-dimensional vertical and horizontal vectors. To explicitly create a vertical vector
np.array([[1,2,3,4,5]]).T
Or
np.array([1,2,3,4,5])[:,np.newaxis)]
And. -> Reference article