Basic study of OpenCV with Python
Outline
- Creating an environment --Image generation --Image loading --Average value of image color --Tweaking the pixels --Trimming --Resize --Addition --Affine transformation --Inverted --Grayscale conversion --Use the drawing function Circle. --Color extraction --Color channel replacement --alpha channel operation * On the way
Creating an environment
Yes well. I have to study image processing properly. .. !! That would be openCV! Where I thought It's hard to set up an environment to play with openCV. Ordinary people. I'm going to play with python for the time being. The composition is
- pyenv-virtualenv
- anaconda
- opencv
(Mac OSX Yosemite 10.10.5,Python 2.7.11,opencv 2.4.12)
is. I regret that it is not this time. .. Since there is a lot of information written in opencv2 in python2.7, this may be enough for studying for the time being. In my case, pyenv-virtualenv was used in homebrew a long time ago. I'm sorry if you don't have version control. Create a pyenv-virtualenv environment with Homebrew on Mac Maybe you can do it if you refer to this.
Once the pyenv environment is created Move to the directory you want to study
cd ~/study/st_opencv/

pyenv install anaconda-2.1.0
pyenv local anaconda-2.1.0
pyenv rehash

~~After installation
conda install -c https://conda.binstar.org/jjhelmus opencv
Dorya. Now you can play with opencv. Too easy Thank you here The easiest way to use OpenCV with python
Image generation
import numpy as np
import cv2

r = 0
g = 0
b = 255

width = 480
height = 360
pixel = np.array([b,g,r],np.uint8)
wGrid = np.array([pixel]*width,np.uint8)
newImg = np.array([wGrid]*height,np.uint8)

cv2.imshow('generate img',newImg)
cv2.imwrite('createimg.png',newImg)
cv2.waitKey(0)

Image loading
# -*- coding: utf-8 -*-
import cv2, matplotlib
import numpy as np
import matplotlib.pyplot as plt

img = cv2.imread('sample.png')

cv2.imshow('result',img)
cv2.waitKey(0)

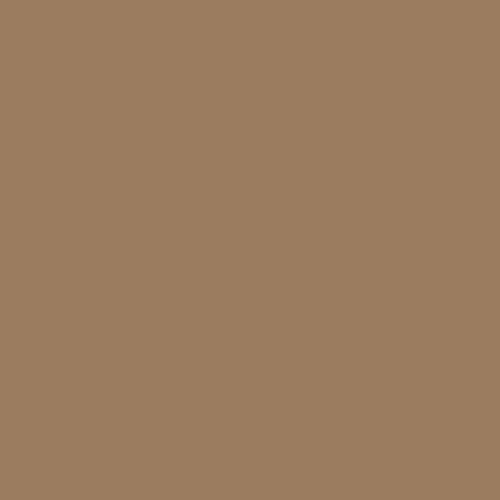
Get the average color of the image
# -*- coding: utf-8 -*-
import cv2, matplotlib
import numpy as np
import matplotlib.pyplot as plt

img = cv2.imread('sample.png')

average_color_per_row = np.average(img, axis=0)
average_color = np.average(average_color_per_row, axis=0)
average_color = np.uint8(average_color)
average_color_img = np.array([[average_color]*500]*500, np.uint8)


cv2.imshow('average',average_color_img)
cv2.imwrite('avarage.png',average_color_img)
cv2.waitKey(0)
Play with pixels
# -*- coding: utf-8 -*-
import cv2, matplotlib
import numpy as np
import matplotlib.pyplot as plt

###
#Access to pixels
###

cols = 640
rows = 480

#Image generation
image = cv2.imread('sample.png')

# print image
print image[0,1]

width = image.shape[0]
height = image.shape[1]
amount = 2.0

#Play with every pixel.
for x in xrange(0,width):
  for y in xrange(0,height):
    pixel = image[x,y]
    b = pixel[0]
    g = pixel[1]
    r = pixel[2]

    if x < width/2 and y < height/2:
      color = np.array([b,g,r*amount],np.uint8)
    elif x > width/2 and y < height/2:
      color = np.array([b,g*amount,r],np.uint8)
    elif x < width/2 and y > height/2:
      color = np.array([b*amount,g,r],np.uint8)
    else:
      color = np.array([b*amount,g*amount,r*amount],np.uint8)

    image[x,y] = color
    # image[x,y] = color
# image[0:150,0:110] = [0, 255, 128]
cv2.imshow('image',image)
cv2.imwrite('access_pixel.png',image)

cv2.waitKey(0)
![]()
trimming
# -*- coding: utf-8 -*-
import cv2, matplotlib
import numpy as np
import matplotlib.pyplot as plt

###
#Access to pixels
###

#Image generation
image = cv2.imread('sample.png')

x = 200
y = 180
width = 150
height = 120

dstImg = image[y:y+height,x:x+width]

cv2.imshow('image',image)
cv2.imshow('dst',dstImg)

cv2.imwrite('trimming.png',dstImg)
cv2.waitKey(0)
resize
# -*- coding: utf-8 -*-
import cv2, matplotlib
import numpy as np
import matplotlib.pyplot as plt

###
#Access to pixels
###

#Image generation
image = cv2.imread('sample.png')

width = image.shape[0]
height = image.shape[1]
resizeImg = cv2.resize(image,(height/2,width/2))
cv2.imshow('original',image )
cv2.imshow('resize',resizeImg)
cv2.imwrite('resize.png',resizeImg)
cv2.waitKey(0)
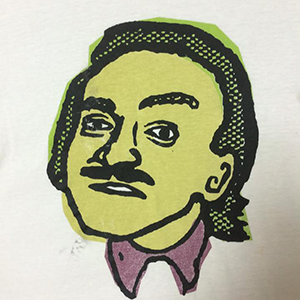
Addition
# -*- coding: utf-8 -*-
import cv2, matplotlib
import numpy as np
import matplotlib.pyplot as plt

###
#Access to pixels
###

#Image generation
sample1 = cv2.imread('addsample1.png')
sample2 = cv2.imread('addsample2.png')

width = 300
height = 300

addImg = np.zeros((height,width,3),np.uint8)

for x in xrange(0,width):
  for y in xrange(0,height):
    addpixel = sample1[x,y] + sample2[x,y]
    addImg[x,y] = addpixel


cv2.imshow('add',addImg)
cv2.imwrite('add.png',addImg)
cv2.waitKey(0)


Affine transformation
# -*- coding: utf-8 -*-
import cv2
import numpy as np

img = cv2.imread('sample.png')

# cv2.imshow('image',img)

width = img.shape[1]
height = img.shape[0]
center = tuple(np.array([width/2, height/2]))
size = tuple(np.array([width,height]))

#Afine that does not specify the rotation axis
#The angle you want to rotate
rad = 45*np.pi/180
movX = 10
movY = 10

matrix = [
  [np.cos(rad),-1*np.sin(rad),movX],
  [np.sin(rad),np.cos(rad),movY]
]

afMat = np.float32(matrix)

#A fine that specifies the axis of rotation
angle = 45
scale = 1.0
rotMat = cv2.getRotationMatrix2D(center,angle,scale)

# afnImg = cv2.warpAffine(img,afMat,size,flags=cv2.INTER_LINEAR)
afnImg = cv2.warpAffine(img,rotMat,size,flags=cv2.INTER_CUBIC)
cv2.imshow('affine image',afnImg)
cv2.imwrite('affine.png',afnImg)
cv2.waitKey(0)
cv2.destroyAllWindows()
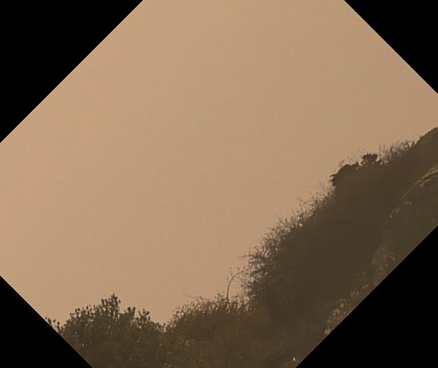
Invert
# -*- coding: utf-8 -*-
import cv2
import numpy as np

img = cv2.imread('sample.png')
rimg = img.copy()
fimg = img.copy()
rimg = cv2.flip(img,1)
fimg = cv2.flip(img,0)

cv2.imshow('Original',img)
cv2.imshow('Vertical',rimg)
cv2.imshow('Horizontal',fimg)

cv2.imwrite('flip-vertical.png',rimg)
cv2.imwrite('flip-horizontal.png',fimg)


cv2.waitKey(0)
cv2.destroyAllWindows()
Flip up and down
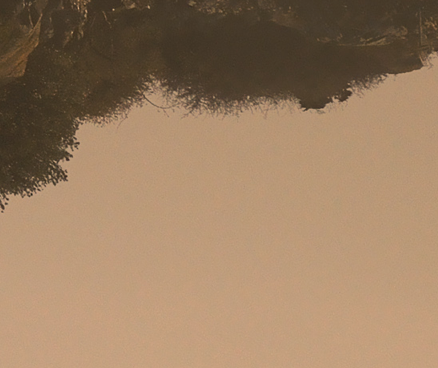
Flip left and right
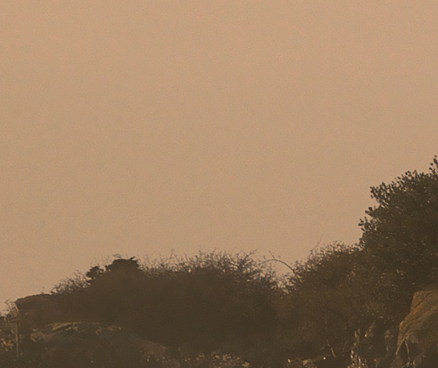
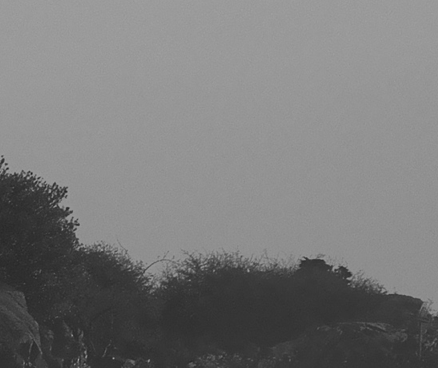
Grayscale conversion
# -*- coding: utf-8 -*-
import cv2, matplotlib
import numpy as np
import matplotlib.pyplot as plt

img = cv2.imread('sample.png')

gray = cv2.cvtColor(img,cv2.COLOR_RGB2GRAY)
cv2.imshow('result',gray)
cv2.imwrite('grey.png',gray)
cv2.waitKey(0)
Use the drawing function Circle.
import cv2
import numpy as np

img = cv2.imread('sample.png')
w = 400
h = 300

plane = np.zeros([300,500],np.uint8)
center = tuple([plane.shape[1]/2,plane.shape[0]/2])
radius = 100
color = tuple([255,0,0])
thickness = 2
cv2.circle(plane,center,radius,color,thickness)
cv2.imshow('plane',plane)
cv2.imwrite('circle.png',plane)
cv2.waitKey(0)

Color extraction
# -*- coding: utf-8 -*-
import cv2
import numpy as np
original = cv2.imread('sample.png', 1)
img = original.copy()
dst = np.zeros(img.shape,np.uint8)

hsv = cv2.cvtColor(img,cv2.COLOR_BGR2HSV)

colorRange = [0,10]
thanSaturate = 0
thanValue = 0

for x in xrange(0,img.shape[1]):
  for y in xrange(0,img.shape[0]):
    # HSV
    if hsv[y,x][0] >= colorRange[0] and hsv[y,x][0] < colorRange[1] and hsv[y,x][1] > thanSaturate and hsv[y,x][2] > thanValue:
      radius = 1
      color = tuple([255,0,0])
      thicness = 1
      cv2.circle(img,tuple([x,y]),radius,color,thicness)

      dst[y,x] = img[y,x]

cv2.imshow('Original',original)
cv2.imshow('Add',img)
cv2.imshow('Diff',dst)
cv2.imwrite('add.png',img)
cv2.imwrite('diff.png',dst)
cv2.waitKey(0)
Original

Extraction

Add

Color channel replacement
import cv2
import numpy as np
import matplotlib
import matplotlib.pyplot as plt

img = cv2.imread('sample.png')
bgr = cv2.split(img)

blue = bgr[0]
green = bgr[1]
red = bgr[2]

# plt.add(blue)
# plt.show(blue)

changeChannel = cv2.merge([red,green,blue])

cv2.imshow('changeChannel',changeChannel)
cv2.imwrite('changeChannel.png',changeChannel)
cv2.waitKey(0)

Click here for source github There is probably a sequel because studying is endless. I also refer to various sites. Thank you everyone.
Recommended Posts