[JAVA] Introduction to Programming for College Students: Draw a Straight Line
Reference: Qiita does not print well. For those who want to print or convert to PDF, please see http://gurakura.sakura.ne.jp/hellomondrian/line/ ( Same content).
What to aim for in this and the next section
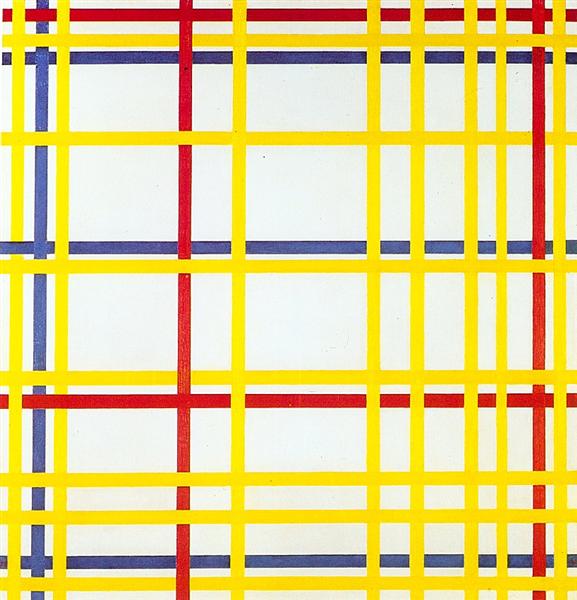 The image above is Piet Mondrian's work New York City I (1942).
https://uploads5.wikiart.org/images/piet-mondrian/new-york-city-i-1942.jpg!Large.jpg
You can see it at.
The image above is Piet Mondrian's work New York City I (1942).
https://uploads5.wikiart.org/images/piet-mondrian/new-york-city-i-1942.jpg!Large.jpg
You can see it at.
The goal of this and the next section is to programmatically draw images like this Mondrian's work. Now that you have prepared the canvas up to previous sentence, I will explain how to draw.
Basics of straight line drawing
In Processing, you can draw a straight line with the line function. The line function also has multiple uses, but since this series does not cover 3D CG, we will explain how to use the line function in 2D (that is, as a drawing on a plane).
In straight line drawing by a program, a computer (= computer) draws a straight line, but in order to do so, it is necessary to tell the computer what kind of straight line it is. There are many ways to represent a straight line. The method used here is to specify the position of the start and end points of a straight line (more precisely, a line segment).
The start point and end point are expressed using their respective coordinates. Specifically, it is used with four arguments, line (x1, y1, x2, y2). Each argument is divided into pairs (x1, y1) and (x2, y2), each representing the position of the start point (x1, y1) and end point (x2, y2) on the canvas.
For example, a program piece called line (20,10,450,400) is nothing more than instructing Processing to "draw a straight line from position (20,10) to position (450,400)". The actual program looks like this:
//canvas setup ← Comment
background(250,250,250);
size(500,500);

//draw a line ← Comment
line(20,10,450,400);
There is an unfamiliar description on the first and fifth lines. This is called a comment and is a memo (annotation) for humans, not for computers.
The two slashes // and after are comments, so the strings canvas setup and draw a line have no programmatic meaning (so don't worry). Of course, when you are writing a program in Processing, if there is something you want to make a note of, you can write // and then write a note (however, the current version (3.5) In .4), it seems that characters are garbled when entering Japanese).
Similarly, the blank line on the 4th line is also a device to make it easier for humans to read. The fourth line is meaningless to Processing (or rather to the programming language Java), as blank lines are skipped as well as whitespace. However, this blank line allows you to visually separate the part where you are preparing the canvas and the part where you draw a line on the prepared canvas. When writing a program, take advantage of these functions and write easy-to-read code (program list).
Quiet talk break. If you run the program list above, you will get results similar to the figure below.

Coordinate system
By the way, what kind of places are the two positions (20,10) and (450,400) given to the line function in the previous program? Will it point? To understand this, we need to understand the coordinate system. The "coordinate system" seems to be difficult, but it's not that difficult.
What is a coordinate axis?
In the description of the coordinate system, we sometimes talk about the x-axis and y-axis. It will appear in this explanation as well. It's enough here to understand what these are all about in the horizontal and vertical directions. The horizontal direction is generally called the x-axis. The x-axis in Processing is also horizontal.
By the way, you are free to decide the orientation of the coordinate axes. Mathematically, it doesn't matter if the x-axis is vertical. In fact, in some areas of the remote sensing field, there is also a culture in which the x-axis points vertically.
Coordinate axis orientation
If this x-axis is oriented and the x-axis is oriented to the right, then increasing the value of x means more to the right. Even in Processing, the x-axis orientation is to the right. So position (20,10) has an x coordinate (= position on the x-axis) of 20, and position (450,400) has an x coordinate of 450, so (450,400) is to the right of (20,10). It becomes.
Now let's talk about the y-axis. In mathematics classes in junior high school and high school, when drawing a graph, I think that the higher the value of the y coordinate, the higher the position. For example, if you draw a bar graph with the y-axis as the temperature, the higher the temperature, the more the bar graph will grow upward.
But in Processing, unlike the mathematics you learned at school, the y-axis points downwards. Therefore, the higher the y-coordinate value, the lower the screen position.
Coordinate origin and scale
Finally, let's talk about the origin-that is, the coordinates (0,0) -and the magnitude of the coordinates. So far, we know the orientation and orientation of Processing's x-axis and y-axis. The x-axis is pointing to the right and the y-axis is pointing down.
However, the position cannot be determined only by the orientation of the coordinates. Where is at least one point in coordinates located on the Proessing screen? Also, how much position change does the x and y coordinates increase by 1? If you don't know it, you can't pinpoint the location.
Since the directions of the x-axis and y-axis are already known, for example, if the upper left coordinates and the lower right coordinates of the Processing screen (window) are known, it seems that the coordinates can be associated with the position on the screen. In fact, the origin in Processing-the position of (x, y) = (0,0) -is at the top left of the canvas.
So what are the lower right coordinates? This is the size of the canvas minus one each. For example, if size (400,300) is set, the lower right position will be (399,299).
Why is the lower right coordinate subtracted by 1 from the width and height when size (400,300) is used? This is easy to understand if you think of it as having 400 pixels horizontally and 300 pixels vertically. The coordinates indicate the position of each pixel, the leftmost pixel is the 0th pixel, the next is the 1st pixel, and so on, and the 400th pixel is the 399th pixel. (0,1,2, ... 399 gives a number of 400).
So the program that draws the diagonal from top left to bottom right looks like this:
// canvas setup
background(250,250,250);
size(400,300);

// draw a line
line(0,0,399,299);
Draw a picture with a program
With the explanation so far, the line function has enabled the minimum drawing. Of course, you can use the line function as many times as you like, and you can call it with different arguments.
Now, let's actually draw a picture with the program. It's far from Mondrian's New York City I (the image at the top of this page), but when I run the following program,
// canvas setup
background(250,250,250);
size(500,500);

// draw lines
line(  0, 30,500, 30);
line( 20,  0, 20,500);
line(400,  0,400,500);
line(  0,300,500,300);
You will get the following display:

As for which line function draws which line, if the x-coordinate values are the same, a vertical line is drawn, and if the y-coordinate values are the same, a horizontal line is drawn. Is a good hint.
The sixth line of the program list above calls the line function as line (0,30,500,30). This is the line connecting the coordinates (0,30) and (500,30). The y coordinate is 30 in both positions, so it's nothing more than drawing a horizontal line with a y coordinate of 30. If you look carefully, you can see that there is a similar code (a piece of code in the program) on the 9th line, which draws a total of two horizontal lines.
Similarly, if the x-coordinates are the same, draw a vertical line. In the program list, the 7th and 8th lines have the same x-coordinates for the start and end points. The 7th line calls the line function to draw a vertical line with an x-coordinate of 20, and the 8th line calls a line function to draw a vertical straight line with an x-coordinate of 400.
That's all for this time. It's very easy, but the program has made it possible to create pictures. Next time, we'll learn how to make these lines more attractive.
Column 1: Are the coordinates in the line function free?
In the program list above, the size of the canvas is 500 in height and width, but the coordinate value given by the line function is 500. Those who read this document well may have wondered, "What?"
For this program, the lower right coordinate of the cabas is (499,499). So, for example, the code on line 7 (20,0,20,500) seems to violate this principle.
But this is a perfectly normal Processing program. That's because the lower right coordinate is certainly (499,499), but it's not a rule that the x and y coordinates must not exceed 500. On the contrary, it is permissible for the x and y coordinate values to take negative values.
In a sense, there is a very large plane, and a part of that plane is displayed in the window as a rectangle with (0,0) at the upper left and (499,499) at the lower right. You can think of it as doing. So it doesn't matter if the coordinates are greater than 499 or negative. Only some of these straight lines drawn on a large plane are cut out and displayed on the canvas. By the way, displaying only a part of the area like this is called clipping.
Column 2: Is there any space in the program?
Another theme of freedom. In the program list above, spaces are inserted in the argument part of the line function to make it easier to see. Many programming languages, including the Java language used in Processing, ignore whitespace wherever appropriate. In other words, there may or may not be spaces.
Of course, you can't write the name of the line function with spaces such as l i n e. In Processing, like many programming languages, You cannot put a space in the middle of the function name. Also, the number 400 cannot be written as 400. However, you can write 400,0 specified as an argument with spaces such as 400, 0.
You can write a program that is easier to read by inserting spaces as appropriate. Programs feel like a world dominated by logic, but instead, like literary works (which may be overstated), there are tasty program lists and concise and sharp program lists. To do.
Recommended Posts