I studied four libraries of Python 3 engineer certified data analysis exams
The main library of exam questions
** 67.5% ** will be given from the exam questions in the four libraries NumPy, pandas, Matplotlib, and scitit-learn. I think that if you suppress this, you will almost certainly pass, so I studied briefly. I hope it will be useful for those who will receive it in the future. (I haven't taken the exam yet)
About Python 3 Engineer Certification Data Analysis Exam Pre-Examination Learning
NumPy
Numpy occupies ** 15% ** of the exam questions, and the basic operation is not difficult, so if you actually write it several times with the jupyter notebook, you will naturally remember it.
reshape
a1 = np.array([0, 1, 2, 3, 4, 5])

#Convert to a 2x3 array
a2 = a1.reshape((2, 3))

a2
array([[0, 1, 2],
       [3, 4, 5]])

#ValueError if the number of elements does not match
a3 = a1.reshape((3, 4))
---------------------------------------------------------------------------
ValueError                                Traceback (most recent call last)
<ipython-input-23-304b0b5b4ab2> in <module>
----> 1 a3 = a1.reshape((3, 4))

ValueError: cannot reshape array of size 6 into shape (3,4)
rabel, flatten Both rabel and flatten recreate the array, but label returns a ** reference **, while flatten returns a ** copy ** If it is a reference, it is called Shallow Copy, otherwise it is called Deep Copy.
#Connect the arrays
a4 = a2.ravel()
a4
array([0, 1, 2, 3, 4, 5])

a5 = a2.flatten()
a5
array([0, 1, 2, 3, 4, 5])

a4[1] = 10
a4
array([ 0, 10,  2,  3,  4,  5])

a5[2] = 20
a5
array([ 0,  1, 20,  3,  4,  5])

# a4(ravel)The part changed in is also affected by a2, but a5 (flatten)The part changed in does not affect a2
a2
array([[ 0, 10,  2],
       [ 3,  4,  5]])
linspace Create evenly divided data by specifying a range
np.linspace(0, 1, 5)
array([0.  , 0.25, 0.5 , 0.75, 1.  ])

#This alignment is used when drawing a graph of the sin function
np.linspace(0, np.pi, 21)
array([0.        , 0.15707963, 0.31415927, 0.4712389 , 0.62831853,
       0.78539816, 0.9424778 , 1.09955743, 1.25663706, 1.41371669,
       1.57079633, 1.72787596, 1.88495559, 2.04203522, 2.19911486,
       2.35619449, 2.51327412, 2.67035376, 2.82743339, 2.98451302,
       3.14159265])
np.diff Returns the difference between elements
d = np.array([10, 5, 3, 3, 10])
np.diff(d)
#There is a difference before and after
array([-5, -2,  0,  7])
concatenate Connect
#Create two arrays
b1 = [1, 3, 5]
b2 = [2, 4, 6]

b3 = np.concatenate([b1, b2])
b3
#Two arrays are concatenated
array([1, 3, 5, 2, 4, 6])

#Make a two-dimensional array
b3 = b3.reshape((2, 3))
b3
array([[1, 3, 5],
       [2, 4, 6]])

#Create another 2D array
b4 = np.array([[10], [20]])
b4
array([[10],
       [20]])

#Concatenation of two-dimensional arrays
b5 = np.concatenate([b3, b4], axis=1)
b5
array([[ 1,  3,  5, 10],
       [ 2,  4,  6, 20]])

#Same behavior with hstack
np.hstack([b3, b4])
array([[ 1,  3,  5, 10],
       [ 2,  4,  6, 20]])

#Create a new one-dimensional array
b6 = np.array([100, 200, 300, 400])
b6
array([100, 200, 300, 400])

#Concatenation to increase rows with vstack
b7 = np.vstack([b5, b6])
b7
array([[  1,   3,   5,  10],
       [  2,   4,   6,  20],
       [100, 200, 300, 400]])
hsplit, vsplit Splitting a two-dimensional array
#Divide the b7 array used for concatenation into two. The second argument indicates how many columns to make.
a1, a2 = nphsplit(b7, [2])
a1
array([[  1,   3],
       [  2,   4],
       [100, 200]])

#The remaining column of the second argument is a2. Two columns here.
a2
array([[  5,  10],
       [  6,  20],
       [300, 400]])

#vsplit splits in the row direction
a1, a2 = np.vsplit(b7, [2])
a1
array([[ 1,  3,  5, 10],
       [ 2,  4,  6, 20]])

a2
array([[100, 200, 300, 400]])
T Swapping rows and columns is called ** transpose **
#Use a1 used in the division.(2×4)queue
a1
array([[ 1,  3,  5, 10],
       [ 2,  4,  6, 20]])

#Transpose to a 4x2 matrix
a1.T
array([[ 1,  2],
       [ 3,  4],
       [ 5,  6],
       [10, 20]])
meshgrid Grid data generation Used when drawing contour lines and heat maps. From the x-coordinate and y-coordinate arrays, the coordinate data of all points created by combining them is generated.
e = np.arange(0, 4)
e
array([0, 1, 2, 3])

f = np.arange(4, 7)
f
array([4, 5, 6])

#Generates grid (on the grid) data with e and f in the row and column directions.
ee, ff = np.meshgrid(e, f)

ee
array([[0, 1, 2, 3],
       [0, 1, 2, 3],
       [0, 1, 2, 3]])
ff
array([[4, 4, 4, 4],
       [5, 5, 5, 5],
       [6, 6, 6, 6]])
Universal function
abs function
Absolute value can be calculated
#Create an array with negative values
a = np.arange(-3, 3).reshape((2, 3))
a
array([[-3, -2, -1],
       [ 0,  1,  2]])

#Find the absolute value
np.abs(a)
array([[3, 2, 1],
       [0, 1, 2]])
sin function, cos function, log function
Since sin and cos are differential and are used as a matter of course in prosecution analysis, they cannot start unless the differential is known. It is very important to understand when and what is useful.
b = np.linspace(-1, 1, 10)
b
array([-1.        , -0.77777778, -0.55555556, -0.33333333, -0.11111111,
        0.11111111,  0.33333333,  0.55555556,  0.77777778,  1.        ])

#sin function
np.sin(b)
array([-0.84147098, -0.70169788, -0.52741539, -0.3271947 , -0.11088263,
        0.11088263,  0.3271947 ,  0.52741539,  0.70169788,  0.84147098])

#cos function
np.cos(b)
array([0.54030231, 0.71247462, 0.84960756, 0.94495695, 0.99383351,
       0.99383351, 0.94495695, 0.84960756, 0.71247462, 0.54030231])

c = np.array([0, 1, 2])
c
array([0, 1, 2])

#log function Calculates the natural logarithm log based on the Naipia number.-inf means minus infinity.
np.log(c)
array([      -inf, 0.        , 0.69314718])
pandas
pandas is a data acquisition and processing tool
It's not difficult to use, and you can roughly understand it by looking at the reference materials. It accounts for ** 17.5% ** of exam questions. Processing data is a bit tricky to remember, but it's not difficult.
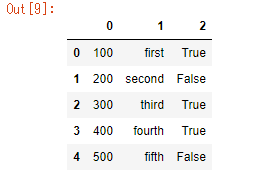
import pandas as pd

d = pd.DataFrame([[100, "first", True],
                 [200, "second", False],
                 [300, "third", True],
                 [400, "fourth", True],
                 [500, "fifth", False]])
d
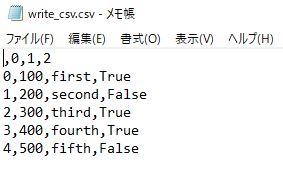
Can read and write ** CSV ** and ** Excel ** files.
#Write CSV
d.to_csv("write_csv.csv")
Matplotlib
A library for drawing 2D graphs in python. It accounts for ** 15% ** of exam questions.
You can draw detailed graphs such as line graphs, bar graphs, and scatter plots. The difficulty level is not high at all.
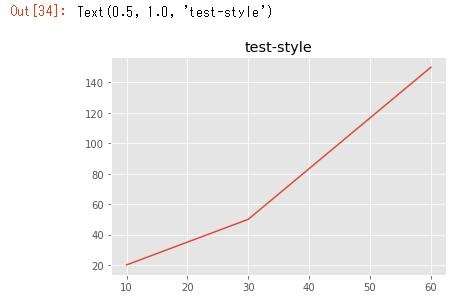
import matplotlib.pyplot as plt
import matplotlib.style
import numpy as np

matplotlib.style.use('ggplot')

x = [10, 30, 60]
y = [20, 50, 150]

fig, ax = plt.subplots()
ax.plot(x, y)
ax.set_title('test2-style')
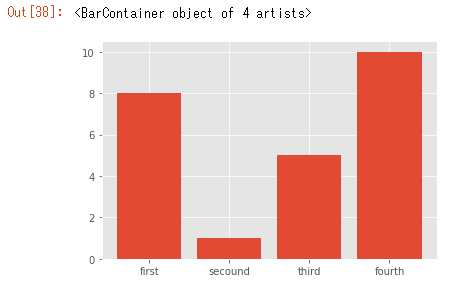
fig, ax = plt.subplots()
x = [1, 2, 3, 4]
y = [8, 1, 5, 10]
labels = ['first', 'secound', 'third', 'fourth']
ax.bar(x, y, tick_label=labels)
fig, ax = plt.subplots()
np.random.seed(500)
x = np.random.rand(80)
y = np.random.rand(80)
ax.scatter(x, y)
scikit-learn
** scikit-learn ** is the heart of this engineer-certified data analysis exam. ** 20% ** of the exam questions come from here. And scikit-learn is a library that performs the ** preprocessing ** process, which is the most important part of data analysis.
** Classification **, ** Regression **, ** Supervised learning **, ** Support vector machine **, ** Decision tree **, ** Clustering **, etc. are familiar words for machine learning. , The chapter of scikit-learn in the reference material seems to be a little more memorable for those who have never touched machine learning. As a learning method, there are many articles that are easier to understand if you do not understand after reading the reference documents once, so it is recommended to google this part rather than reading a book many times. It is also recommended to look for video materials on Udemy.
Summary
It is no exaggeration to say that the engineer certification data analysis test is a library usage test. It's difficult to remember just by reading a book, and you have to actually move it somehow, but I don't think it's a difficult test for anyone who has a little bit of machine learning. If you have never studied machine learning, reading a book will make the scikit-learn chapter difficult.
Recommended Posts