Handle Ambient data in Python
We will introduce an example of reading the data of the sensor data visualization service "Ambient" in Python, converting it to a pandas DataFrame, and graphing it. The data treated as an example is the data such as temperature, humidity, and atmospheric pressure measured by ESP8266 Arduino, and it is "Veranda Environmental Monitor @ Setagaya Sakuraoka" Is published as.
The environment in which Python was executed
- Mac OS X 10.11.6
- Python 3.5.2 :: Anaconda 4.2.0
- jupyter 4.2.0 is.
Ambient
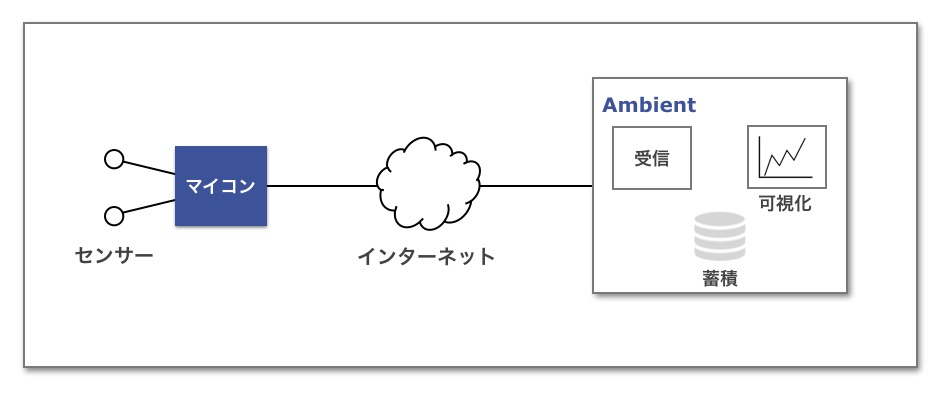
Ambient is an IoT data visualization service that receives, stores, and visualizes (graphs) sensor data sent from microcomputers. You can easily send sensor data from Arduino, mbed, Raspberry Pi, etc. to Ambient and graph it.
For more information on how to use Ambient, see "Try Ambient". For an example of the ambient monitor, see "Making a home ambient monitor with ESPr Developer + Ambient".
Installing the Ambient Python library
Ambient's Python library has the ability to send data to Ambient and the ability to read the data stored in Ambient.
You can install the library from Github as follows.
$ pip install git+https://github.com/TakehikoShimojima/ambient-python-lib.git
For more information on the library, see "Python Library".
Loading the library
From here on, I'm running on jupyter notebook. Load the library as follows.

Read data from Ambient
First, specify the channel Id, write key, and read key to create an instance of Ambient. If you only want to read, you can specify "Write key". In the case of public channel, the read key can be omitted. The data handled as an example this time is published as "Veranda Environment Monitor @ Setagaya Sakuragaoka". , Channel Id is 102, so you can create an instance as below.

There are two ways to read data: specify the number of data items, specify the date, and specify the period.
- d = am.read (n = 100, skip = 100) # Skip 100 items from the latest and read 100 items
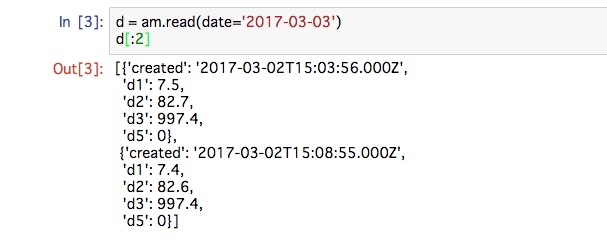
- d = am.read (date = '2017-03-02') # Read the data of March 2, 2017
- d = am.read (start ='2017-03-02 00:00:00', end ='2017-03-02 01:00:00') # March 2, 2017 from 0:00 to 1:00 Read the data of
Both methods return an array in dictionary format (JSON format) that looks like this:
[
    {'created': '2017-02-25T15:01:48.000Z', 'd1':Numerical value, 'd2':Numerical value, 'd3':Numerical value},
    {'created': '2017-02-25T15:06:47.000Z', 'd1':Numerical value, 'd2':Numerical value, 'd3':Numerical value},
    ...
]
The data creation time'created'is displayed in Coordinated Universal Time (UTC). The data is sorted in ascending order of generation time (oldest to newest).
Convert to pandas DataFrame
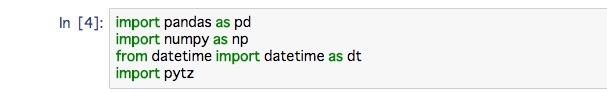
Load the modules you will need in the future.
Then convert this data to a pandas DataFrame. It's really easy, just do the following:
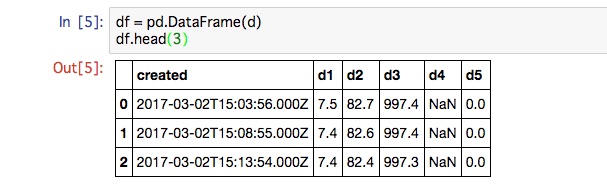
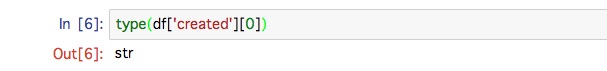
The data generation time df ['created'] is the character string. If this is left as it is, the subsequent processing will be inconvenient, so convert this to pandas Timestamp.
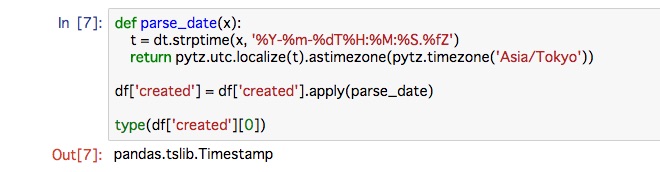
The character string is converted to Datetime with strptime (), and Japan ('Asia / Tokyo') is set as the time zone.
Since read_csv of pandas has a function to parse the time in string format and convert it to Timestamp, I think that there is a similar function when creating a DataFrame from an array in dictionary format, but I could not find it. , I converted it by myself as above. If anyone knows an easier way to do this, please let me know.
Graph the data with matplotlib
Next, let's graph the data with matplotlib.

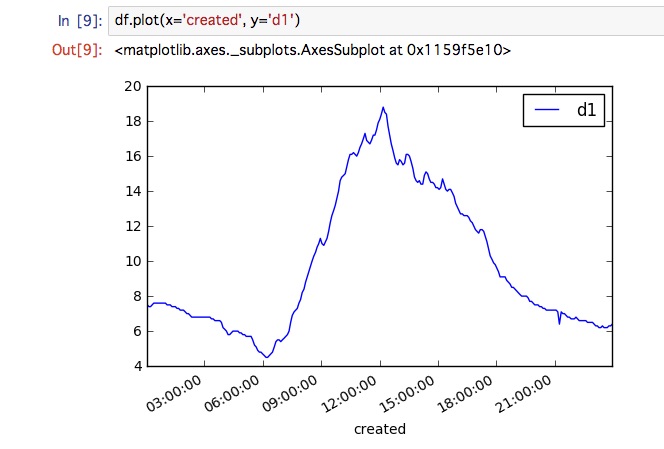
First, let's make a line graph of the read temperature on March 3rd.
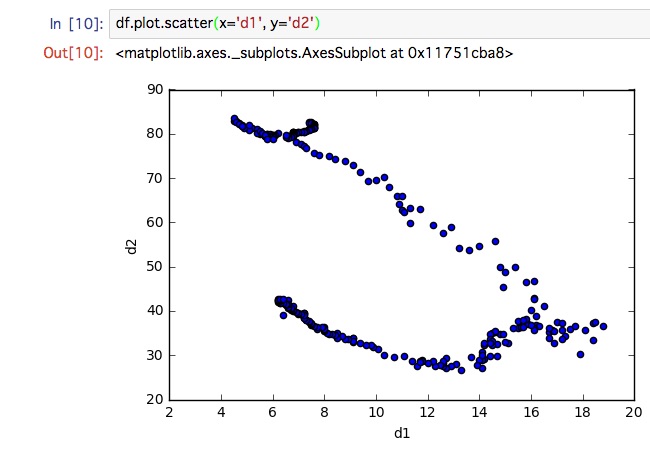
Next, let's graph the correlation between temperature and humidity.
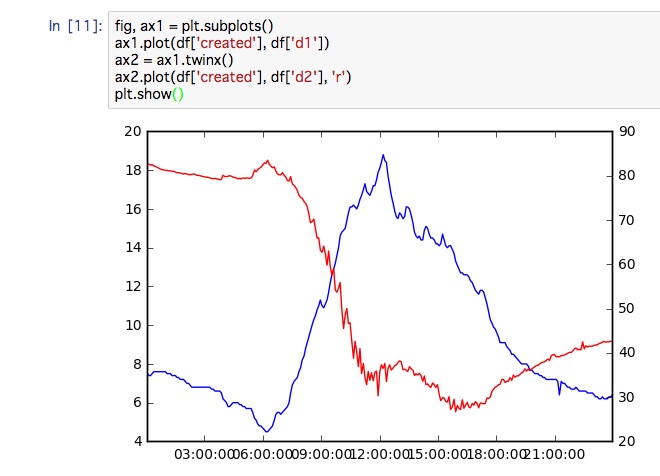
Let's graph the changes in daily temperature and humidity with temperature on the left axis and humidity on the right axis.
Up to this point, you can graph with the Ambient function, but with Python + pandas + matplotlib, you can graph more flexibly.
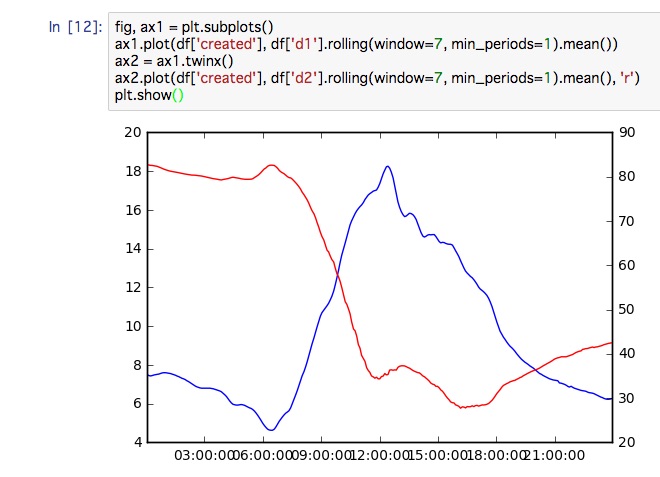
Let's calculate and graph the moving average of the same temperature and humidity as above. You can calculate the moving average of width 7 by using df ['d1']. Rolling (window = 7, min_period = 1) .mean () instead of df ['d1'] as data.
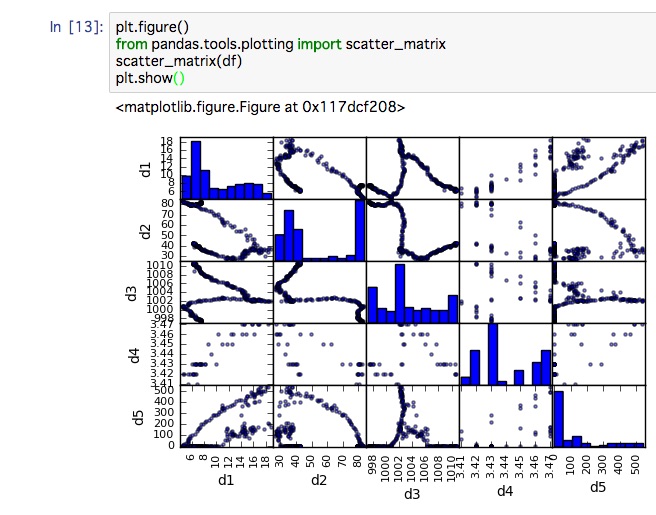
Let's make a scatterplot matrix of temperature, humidity, barometric pressure, power supply voltage, and illuminance.
Summary
By combining Ambient with Python, pandas, and matplotlib, sensor data controlled by a microcomputer can be accumulated, simple visualization (graphing) can be performed with Ambient, and more flexible analysis and visualization can be performed with Python. I hope it will be helpful when analyzing actual sensor data with Python.
Recommended Posts