Drawing tips with matplotlib on the server side
In many cases, the calculation is executed remotely in the work of "calculating, plotting and confirming the result". The options that come to mind for this workflow are:
- Save the output data (log) of the calculation result to a file. (It may be text-based or serialized.) Transfer it to the client, and draw and check it with another program.
- Use Jupyter Notebook. Run the Jupyter Notebook service on the server, connect with the Web Browser from the client, and of course check the figure on the Browser.
- Connect to the server via Remote Desktop and perform a series of operations.
- Draw and output the figure file on the server side. View image files such as PNG and PDF on the client PC.
In the past, I often chose options 1 and 2, but this time I would like to introduce tips on server-side drawing of ** option 4 **.
First failure
When I said, "There was savefig () in matplotlib.pylot."
Traceback
...(Omitted)
RuntimeError: Invalid DISPLAY variable
An error will occur as in. This is probably because the DISPLAY that is the display destination is not set. You can take measures by searching the net and specifying the backend of matplotlib.
import numpy as np
import matplotlib as mpl
mpl.use('Agg')
import matplotlib.pyplot as plt
from mpl_toolkits.mplot3d import axes3d
from matplotlib import cm

def sphere_func(x, y):
    z = x * x + y * y

    return z

def contr3d1():
    ndiv = 200
    xp = np.linspace(-4., 4., ndiv)
    yp = np.linspace(-4., 4., ndiv)

    xx, yy = np.meshgrid(xp, yp, sparse=True)

    zp = sphere_func(xx, yy)

    fig = plt.figure()
    ax = fig.gca(projection='3d')
    ax.plot_surface(xx, yy, zp,
        rstride=6, cstride=6, alpha=0.7, cmap=cm.rainbow)
    ax.set_zlim(-1.0, 40.)

    # plt.show()

    fig.savefig('sphere_3d.png')

if __name__ == '__main__':
    contr3d1()
At the beginning of the program, where the module is imported, matplotlib specifies to use AGG (Anti-Grain Geometry engine).
import matplotlib as mpl
mpl.use('Agg')
import matplotlib.pyplot as plt
The point is to put this statement mpl.use ('Agg') before importing matplotlib.pyplot. Now savefig () works normally.
Specify matplotlib backends
I specified'AGG'this time, but according to the matplotlib documentation, there are several types of backends available.
** Non-interactive backends (quoted from matplotlib documentation) **
| Renderere | Filetypes | Description |
|---|---|---|
| AGG | png | raster grapahics - high quality images using the Anti-Grain Geometry engine |
| PS | ps eps | vector graphics - Postscript output |
| PDS | vector graphics - Portable Document Format | |
| SVG | svg | vector graphics - Scalable Vector Graphics |
| Cairo | png ps pdf svg ... | vector graphics - Cairo graphics |
| GDK | png jpg tiff ... | raster graphics - the Gimp Drawing Kit |
I tried to specify'SVG'and executed it, but the SVG file was output normally.
(The programming environment is OS Ubuntu-14.04 LTS, Python 2.7.11, Anaconda 2.4.1 with a series of libraries (numpy, matplotlib, etc.).)
Unexpected Visual Studio Code graphic display function
The graphic file was successfully output. You can use any graphic display tool you like, but here we recommend Visual Studio Code. As you know, Visual Studio Code is a text editor, so it mainly handles text, but you can open it in Folder units, and you can work while actively switching files in it. By chance, when I specified (touched) an image file (png), the image was displayed, and I was able to notice this function.
(File is shared by the server service (smb). The server folder is opened by Visual Studio Code on the client (windows) side.)
** Fig. Visual Studio Code (display code normally) **

** Fig. Visual Studio Code (display image file (png)) **
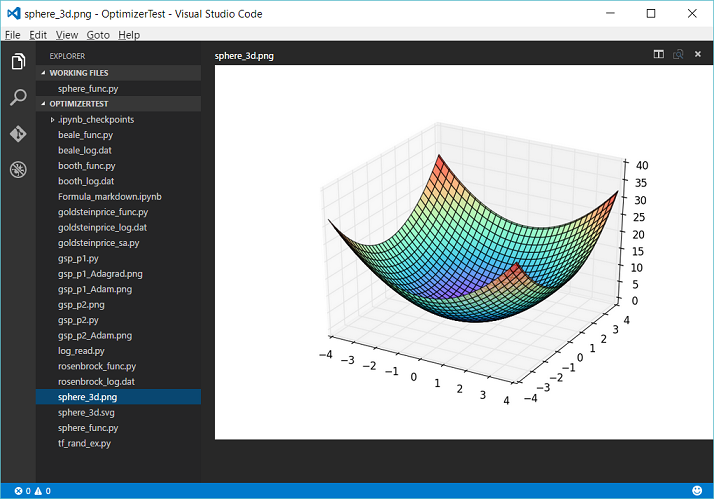 You can see the image file (png).
** Fig. Visual Studio Code (Display SVG file) (bonus) **
 I wondered if it would be rendered, but SVG was text.
In this way, it is very convenient because you can check the figure without leaving the work of the text editor.
Why does the editor support the image display function? I was a little skeptical, but I imagine that it was necessary to add an image display function when adding the preview function for Markdown editing.
(Visual Studio Code used version 0.10.8.)
References (web site)
--How to prevent recurrence of matplotlib moss problem with undefined $ DISPLAY --Qiita http://qiita.com/nishio/items/0a8949262d86c181668b
- Matplotlib Document http://matplotlib.org/faq/usage_faq.html#what-is-a-backend
- Matplotlib: display plot on a remote machine - stackoverflow http://stackoverflow.com/questions/3453188/matplotlib-display-plot-on-a-remote-machine
- How to save a figure remotely with pylab? - stackoverflow http://stackoverflow.com/questions/4706451/how-to-save-a-figure-remotely-with-pylab
- Microsoft - Visual Studio Code https://code.visualstudio.com/
Recommended Posts