A collection of methods used when aggregating data with pandas

Read CSV file

data = pd.read_csv("sample.csv", encoding="UTF-8")
data

result

スクリーンショット 2017-07-28 22.27.31.png

Contents of sample.csv

Unnecessary,Unnecessary,Unnecessary,Unnecessary,Unnecessary,Unnecessary
Unnecessary,Title A,Title B,Title C,Title D,Unnecessary
Unnecessary,10,20,30,40,Unnecessary
Unnecessary,100,200,300,400,Unnecessary
Unnecessary,Unnecessary,Unnecessary,Unnecessary,Unnecessary,Unnecessary

I save the data in the Google spreadsheet as CSV and imagine the data when analyzing it. I think there are quite a few sheets where memos and remarks are written without being structured. I think that you can select the range when saving, but this time I will try to organize it with pandas after practicing.

Change the contents of the specified line to the column name

data.columns = data.iloc[0]
data

result

スクリーンショット 2017-07-28 22.29.14.png

Extract only specified rows / columns

data = data.iloc[1:3,1:5]
data

result

スクリーンショット 2017-07-28 22.33.12.png It's just what I want.

Produce various summary statistics (failure)

data.describe()

result
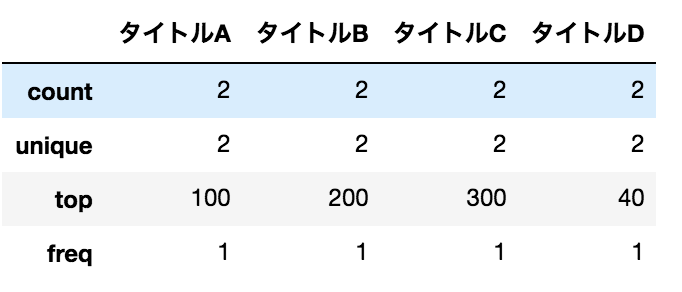
スクリーンショット 2017-07-28 22.34.37.png I thought that the average etc. would come out, but it doesn't. This is because the value type is not numeric.

Change the value type

data = data.astype('int')
data

result

スクリーンショット 2017-07-28 22.37.16.png

Produce various summary statistics (success)

data.describe()

result

スクリーンショット 2017-07-28 22.38.23.png

Get the correlation coefficient

data.corr()

result
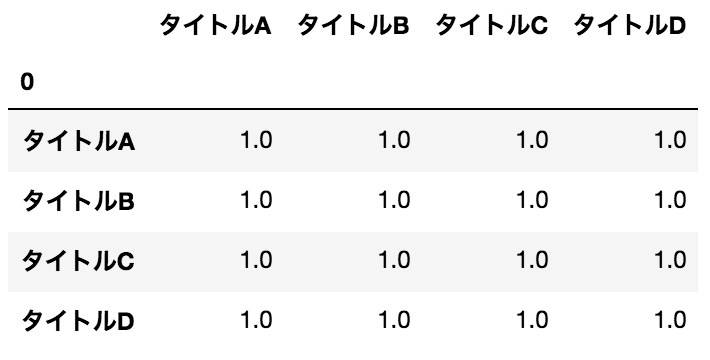
スクリーンショット 2017-07-28 22.39.15.png #### Remarks I don't know what the 0 in the upper left is

Various other things

data.sum() #total
data.skew() #skewness
data.kurt() #kurtosis
data.var() #Distributed
data.cov() #Covariance matrix

Remarks

Display a boxplot

%matplotlib inline #Required to display on page
data.plot(kind='box')

result
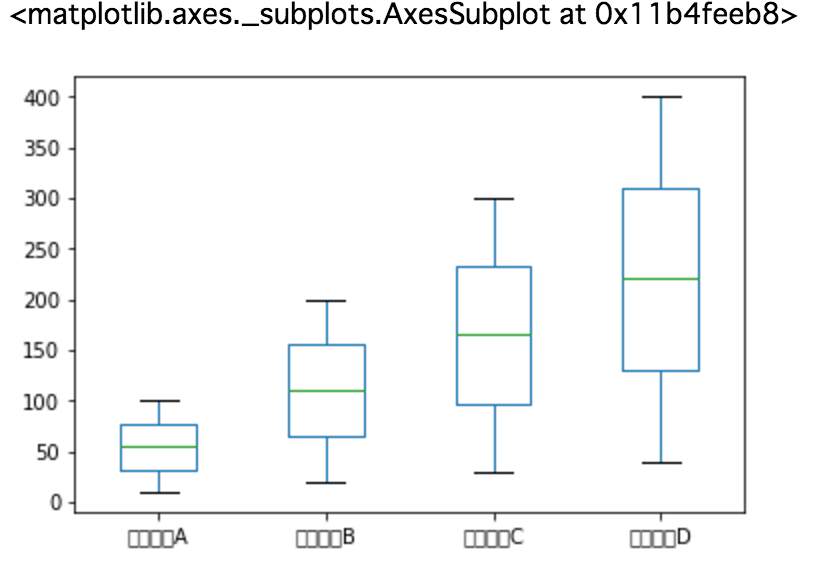
スクリーンショット 2017-07-28 22.44.26.png #### Remarks The Japanese label is not displayed, but Japanese is ``` matplotlib.rcParams['font.family'] = 'M+ 1c' #Specifiable font ``` It can be displayed by specifying as. The fonts that can be specified are ``` import matplotlib.font_manager as fm fm.findSystemFonts() ``` You can find out at. http://qiita.com/hagino3000/items/1b54acc01483ccd0ac72 I referred to.

DataFrame join (row direction)

pd.concat([data,data])

result

スクリーンショット 2017-07-28 22.48.35.png

Join DataFrame (column direction)

pd.concat([data,data], axis=1)

result

スクリーンショット 2017-07-28 22.49.28.png

Change all values

data.pipe(lambda df: df / 2)

result

スクリーンショット 2017-07-28 22.50.29.png

Sort by value

data['Title A'].sort_values(ascending = True)

result

スクリーンショット 2017-07-28 22.51.18.png

Recommended Posts

A collection of methods used when aggregating data with pandas
Summary of Pandas methods used when extracting data [Python]
A memorandum of method often used when analyzing data with pandas (for beginners)
The minimum methods to remember when aggregating data in Pandas
Summary of methods often used in pandas
Example of efficient data processing with PANDAS
A memorandum of trouble when formatting data
Manage the overlap when drawing scatter plots with a large amount of data (Matplotlib, Pandas, Datashader)
Make holiday data into a data frame with pandas
Data visualization with pandas
Data manipulation with Pandas!
Shuffle data with pandas
Be careful when reading data with pandas (specify dtype)
A collection of commands frequently used in server management
A collection of Excel operations often used in Python
When reading a csv file with read_csv of pandas, the first column becomes index
A network diagram was created with the data of COVID-19.
Notes on handling large amounts of data with python + pandas
Can be used with AtCoder! A collection of techniques for drawing short code in Python!
Ingenuity to handle data with Pandas in a memory-saving manner
[Python] Extracts data frames that do not match a specific column with other data frames of Pandas
Data processing tips with Pandas
Two methods of conditional extraction with pandas (single condition, multiple conditions)
A collection of one-liner web servers
Versatile data plotting with pandas + matplotlib
Draw a graph with pandas + XlsxWriter
[Python] Format when to_csv with pandas
Upload data to s3 of aws with a command and update it, and delete the used data (on the way)
A collection of examples for when you're confused by Python's slice notation
Do not change the order of columns when concatenating pandas data frames.
A collection of tips for speeding up learning and reasoning with PyTorch
[Python / Pandas] A bug occurs when trying to replace a DataFrame with `None` with` replace`
A reminder of what I got stuck when starting Atcoder with python
[BigQuery] Load a part of BQ data into pandas at high speed
I made a mistake in fetching the hierarchy with MultiIndex of pandas
The result was better when the training data of the mini-batch was made a hybrid of fixed and random with a neural network.
Import of japandas with pandas 1.0 and above
Add a Python data source with Redash
A little scrutiny of pandas 1.0 and dask
Try converting to tidy data with pandas
A workaround when installing pyAudio with pip.
[Pandas_flavor] Add a method of Pandas DataFrame
Memorandum of Understanding when migrating with GORM
Recommendation of Altair! Data visualization with Python
A brief description of pandas (Cheat Sheet)
Read a character data file with numpy
Pandas: A very simple example of DataFrame.rolling ()
Working with 3D data structures in pandas
Best practices for messing with data with pandas
Introduction of drawing code for figures with a certain degree of perfection of meteorological data
Python scikit-learn A collection of predictive model tips often used in the field
A personal memo of Pandas related operations that can be used in practice
Summary of scikit-learn data sources that can be used when writing analysis articles
Change the data frame of pandas purchase data (id x product) to a dictionary
Practice of creating a data analysis platform with BigQuery and Cloud DataFlow (data processing)
Python scikit-learn A collection of predictive model tips often used in the field
[Introduction to Python] How to get the index of data with a for statement
I tried to make a function to retrieve data from database column by column using sql with sqlite3 of python [sqlite3, sql, pandas]