Tu peux le voir! Comparaison des méthodes d'optimisation (2020)
Personne cible
Pour ceux qui veulent voir une comparaison de chaque méthode d'optimisation. Comparons les méthodes introduites dans ici dans divers espaces de recherche. Si vous avez un autre bon avion de recherche ou un espace de recherche que vous aimeriez essayer, nous attendons des informations.
table des matières
- x^2-y^2
- tanh(x)^2+tanh(y)^2
- -sin(x)/x-sin(y)/y+(x^2+y^2)/7
- [Version haute qualité](# Version haute qualité)
- [Code utilisé](# Code utilisé)
x^2-y^2 Pour le moment
f(x, y) = x^2 - y^2
Cherchons autour de l'origine.
La position initiale est $ (x_0, y_0) = (-1,5, -10 ^ {-4}) $. La coordonnée $ y $ n'est pas 0 car les règles d'apprentissage incluent des choses qui ne supposent pas que l'inclinaison sera complètement $ 0 $.
Eh bien, il est normal de dire que le dégradé n'est pas complètement à 0 $.


 Il existe de nombreuses règles d'apprentissage qui ne sont pas capturées par la selle car il y a un léger gradient dans la direction de l'axe $ y $. Les règles d'apprentissage qui sont capturées finiront par tomber.
Au fait, ça ressemble à ça quand il est complètement nul.
 Le Père Noël s'évapore en un instant et les règles d'apprentissage qui peuvent être complètement nulles sont complètement capturées par la selle. SMORMS3 ne fonctionne plus avec une secousse. Il peut y avoir une erreur dans le code ...
tanh(x)^2+tanh(y)^2 Suivant
f(x, y) = \tanh^2 x + \tanh^2 y
Donc, je l'ai essayé à la position initiale $ (x, y) = (-1, 2) $.
Après tout, seul SMORMS3 tient dans la pointe de selle ...
Le Père Noël est parti quelque part, mais vous pouvez le voir revenir.


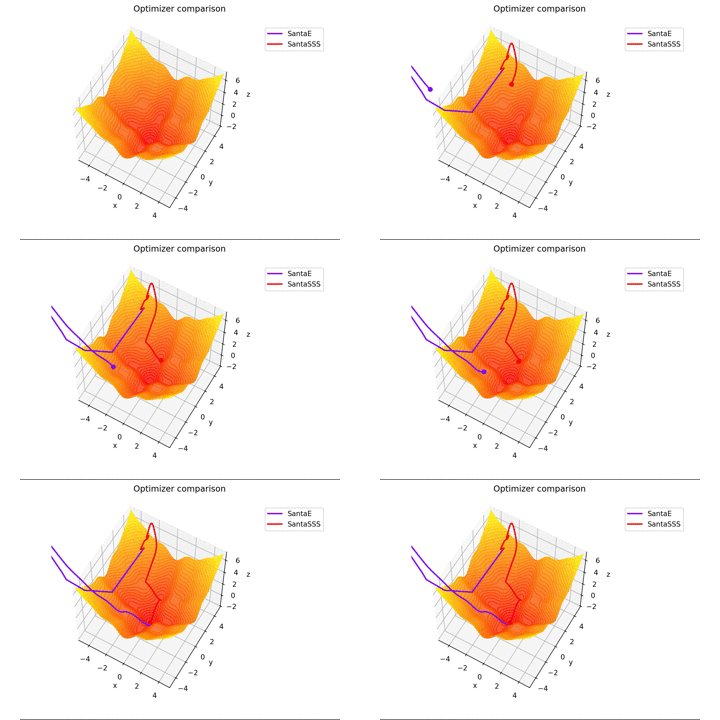
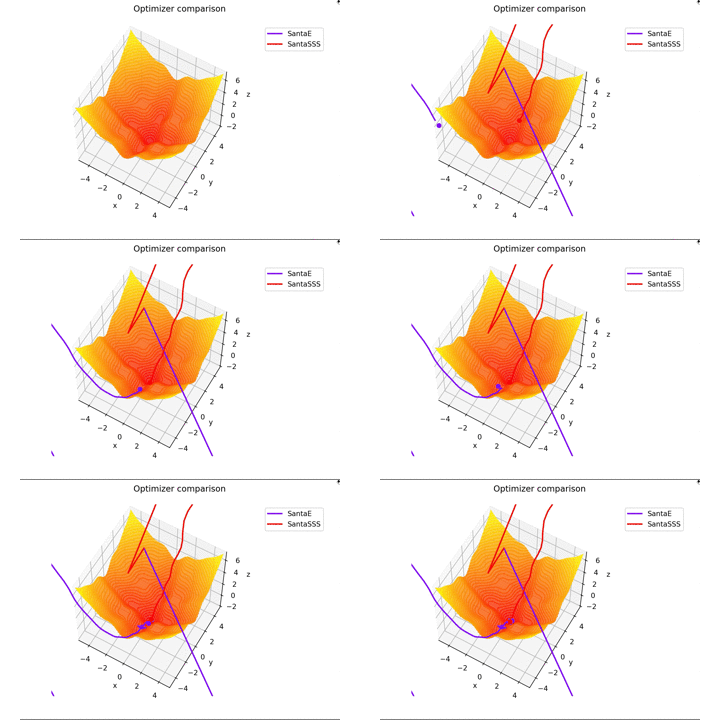
-sin(x)/x-sin(y)/y+(x^2+y^2)/7 continuer
f(x, y) = -\cfrac{\sin (\pi x)}{\pi x} - \cfrac{\sin (\pi y)}{\pi y} + \cfrac{x^2+y^2}{7}
est. Ceci est différent des autres dans $ x, y \ in [-5, 5] $, et la position initiale est $ (x, y) = (-3, 4) $. $ \ Frac {x ^ 2 + y ^ 2} {7} $ est ajouté pour créer une règle d'apprentissage qui s'adapte parfaitement à la selle et une règle d'apprentissage qui ne convient pas.


 En ce qui concerne $ N $ dans la règle d'apprentissage du Père Noël, pour autant que j'ai lu l'article, j'ai senti que c'était le nombre de mini-lots, donc j'ai mis $ N = 1 $, mais si $ N = 16 $, cela convergera fermement. droite...

Au fait, il vibre quand $ N = epoch $.

Je ne vais pas le mettre, mais si vous augmentez $ epoch $ et définissez $ N = epoch $, cela ressemblera à une peinture lol
Après tout, il devrait être reconnu comme le nombre de mini-lots. Pratiquement, $ N = 16,32 $, et à cette valeur, il vibre légèrement.
En ce qui concerne $ N $ dans la règle d'apprentissage du Père Noël, pour autant que j'ai lu l'article, j'ai senti que c'était le nombre de mini-lots, donc j'ai mis $ N = 1 $, mais si $ N = 16 $, cela convergera fermement. droite...

Au fait, il vibre quand $ N = epoch $.

Je ne vais pas le mettre, mais si vous augmentez $ epoch $ et définissez $ N = epoch $, cela ressemblera à une peinture lol
Après tout, il devrait être reconnu comme le nombre de mini-lots. Pratiquement, $ N = 16,32 $, et à cette valeur, il vibre légèrement.
Version de haute qualité
La qualité d'image est plus rugueuse que ce à quoi je m'attendais, je vais donc laisser une petite version de haute qualité.
 La limite de capacité qui a été fermée ...
Code utilisé
Voici le code expérimental. Lorsque je produis une animation avec jupyter notebook, les points et les lignes sont affichés sous le plan de recherche et il est difficile de le voir, donc je l'exécute sur le terminal.
Code expérimental
test.py
#%matplotlib nbagg  #Pour jupyter
import numpy as np
import matplotlib.pyplot as plt
import matplotlib.animation as animation
from mpl_toolkits.mplot3d import Axes3D


from optimizers import *  #Commentez jupyter
#On suppose que le module des optimiseurs se trouve dans le même dossier.


def g(x, y):
    #return (x**2 - y**2) * 1
    #return np.tanh(x)**2 + np.tanh(y)**2
    return -(np.sinc(x) + np.sinc(y)) + (x**2 + y**2)/7


def dgx(x, y):
    #return 2*x * 1
    #return 2 * np.tanh(x) / np.cosh(x)**2
    return np.sin(np.pi*x)/(np.pi * x**2) + 2*x/7 - np.cos(np.pi*x)/x


def dgy(x, y):
    #return -2*y * 1
    #return 2 * np.tanh(y) / np.cosh(y)**2
    return np.sin(np.pi*y)/(np.pi * y**2) + 2*y/7 - np.cos(np.pi*y)/y


num = 401
#x = np.linspace(-2, 2, num)
#y = np.linspace(-2, 2, num)
x = np.linspace(-5, 5, num)
y = np.linspace(-5, 5, num)
X, Y = np.meshgrid(x, y)
Z = g(X, Y)
elevation = np.arange(np.min(Z), np.max(Z), 0.25)
#start_x = -1.5
#start_y = -1e-4
#start_x = -1
#start_y = 2
start_x = -3
start_y = 4
exact_x = 0
exact_y = 0
epoch = 500
N = epoch
seed=2
np.random.seed(seed=seed)
#fig = plt.figure()
#ax = fig.add_subplot(111, projection="3d")
#ax.set_zlim(-1, 1)
#im = ax.plot_surface(X, Y, Z, cmap="autumn")
#fig.show()

opt_dict = {
#    "SDG": SGD(eta=5e-2),
#    "MSGD": MSGD(eta=5e-2),
#    "NAG": NAG(eta=5e-2),
#    "AdaGrad": AdaGrad(eta=1e-1),
#    "RMSprop": RMSprop(eta=5e-2),
#    "AdaDelta": AdaDelta(),
#    "Adam": Adam(alpha=5e-2),
#    "RMSpropGraves": RMSpropGraves(eta=1e-2),
#    "SMORMS3": SMORMS3(eta=1e-2),
#    "AdaMax": AdaMax(alpha=2e-2),
#    "Nadam": Nadam(alpha=2e-2),
#    "Eve": Eve(alpha=5e-2),
    "SantaE": SantaE(eta=1e-3, burnin=10, N=N),
    "SantaSSS": SantaSSS(eta=1e-3, burnin=10, N=N),
#    "AMSGrad": AMSGrad(alpha=5e-2),
#    "AdaBound": AdaBound(alpha=5e-2),
#    "AMSBound": AMSBound(alpha=5e-2),
}
current_x = np.full(len(opt_dict), start_x, dtype=float)
current_y = np.full(len(opt_dict), start_y, dtype=float)

cmap = plt.get_cmap("rainbow")
coloring = [cmap(i) for i in np.linspace(0, 1, len(opt_dict))]

fig = plt.figure()
ax = fig.add_subplot(111, projection="3d")
ax.plot_surface(X, Y, Z, cmap="autumn", alpha=0.8)
ax.contour(X, Y, Z, cmap="autumn", levels=elevation, alpha=0.8)

ax.set_xlim(x[0], x[-1])
ax.set_ylim(y[0], y[-1])
ax.set_zlim(np.min(Z), np.max(Z))
ax.set_position([0.1, 0.1, 0.6, 0.8])
ax.set_xlabel("x")
ax.set_ylabel("y")
ax.set_zlabel("z")
ax.grid()
ax.view_init(60)


paths = np.zeros((epoch + 1, len(opt_dict), 3))
for j in range(len(opt_dict)):
    paths[0, j, 0] = current_x[j]
    paths[0, j, 1] = current_y[j]
    paths[0, j, 2] = g(current_x[j], current_y[j])
for i in range(1, epoch+1):
    for j, opt in enumerate(opt_dict):
        dx, dy = opt_dict[opt].update(dgx(current_x[j], current_y[j]),
                                      dgy(current_x[j], current_y[j]),
                                      t=i,
                                      w=current_x[j], b=current_y[j],
                                      dfw=dgx, dfb=dgy,
                                      f=g(current_x[j], current_y[j]))
        current_x[j] += dx
        current_y[j] += dy
        paths[i, j, 0] = current_x[j]
        paths[i, j, 1] = current_y[j]
        paths[i, j, 2] = g(current_x[j], current_y[j])


class TrajectoryAnimation3D(animation.FuncAnimation):
    def __init__(self, paths, labels=[], fig=None, ax=None, frames=None,
                 interval=60, repeat_delay=5, blit=True, coloring=None,
                 **kwargs):
        if fig is None:
            if ax is None:
                fig, ax = plt.subplots()
            else:
                fig = ax.get_figure()
        else:
            if ax is None:
                ax = fig.gca()

        self.fig = fig
        self.ax = ax
        self.paths = paths

        if frames is None:
            frames = paths.shape[0]

        self.lines = []
        self.points = []
        for j, opt in enumerate(labels):
            line, = ax.plot([], [], [], label=opt, lw=2, color=coloring[j])
            point, = ax.plot([], [], [], marker="o", color=coloring[j])
            self.lines.append(line)
            self.points.append(point)

        super().__init__(fig, self.animate, init_func=self.init_anim,
                         frames=frames, interval=interval, blit=blit,
                         repeat_delay=repeat_delay, **kwargs)

    def init_anim(self):
        for line, point in zip(self.lines, self.points):
            line.set_data([], [])
            line.set_3d_properties([])
            point.set_data([], [])
            point.set_3d_properties([])
        return self.lines + self.points

    def animate(self, i):
        j = int(0)
        for line, point in zip(self.lines, self.points):
            line.set_data(self.paths[:i, j, 0], self.paths[:i, j, 1])
            line.set_3d_properties(self.paths[:i, j, 2])
            point.set_data(self.paths[i, j, 0], self.paths[i, j, 1])
            point.set_3d_properties(self.paths[i, j, 2])
            j += 1
        return self.lines + self.points


anim = TrajectoryAnimation3D(paths, labels=opt_dict, fig=fig, ax=ax,
                             coloring=coloring)
fig.legend(bbox_to_anchor=(0.96, 0.9))
fig.suptitle("Optimizer comparison")
plt.show()
référence
- Tracé 3D avec matplotlib
- Essayez de faire pivoter une carte topographique solide (3D) avec la fonction d'animation de matplotlib
- Visualizing and Animating Optimization Algorithms with Matplotlib
Série d'apprentissage en profondeur
- Introduction au Deep Learning ~ Bases ~
- Introduction au Deep Learning ~ Préparation au codage ~
- Introduction au Deep Learning ~ Propagation en avant ~
- Introduction au Deep Learning ~ Backpropagation ~
- Liste des fonctions d'activation (2020)
- Liste des méthodes de descente de gradient (2020)
- Voir et comprendre! Comparaison des méthodes d'optimisation (2020)
- Compréhension approfondie Im2col
- Compréhension complète de la fonction numpy.pad
Recommended Posts