I tried to make a machine learning application with Dash (+ Docker) part3 ~ Practice ~
Introduction
I created a simple machine learning app using Python's web app framework Dash, so I wrote this article as a learning record (the deliverable is here. /)). The above (part2) introduced Layout and Callback which are the basics of Dash application creation. In this article, I would like to introduce some of the apps that I actually made as application examples. As shown below, implement an application that displays the analysis result selected by the check box for the table data.
 Please see here (part1) for the operating environment. Also, in this article, Pandas is used for data processing, but I think that you can read it with almost no problem even if you do not have knowledge of Pandas.
Preparation
In the actually created application, I added a function to upload csv files etc., but this time I will read the prepared data directly. For the sample_data.csv part, try using your favorite table data of an appropriate size (it is better to have two or more numeric variables to implement a pair plot). This article uses Kaggle's Titanic competition data (train.csv).
<Directory structure>
Dash_App/
  ├ sample_data.csv
  ├ app.py
  ├ Dockerfile
  └ docker-compose.yml
The parts other than Layout and Callback should be as follows.
app.py
import dash
import dash_core_components as dcc
import dash_html_components as html
from dash.dependencies import Input, Output, State
import pandas as pd
import plotly.express as px
import plotly.figure_factory as ff

#Data reading
data = pd.read_csv('src/sample_data.csv')

external_stylesheets = ['https://codepen.io/chriddyp/pen/bWLwgP.css']
app = dash.Dash(__name__, external_stylesheets=external_stylesheets)
################################################################
Layout part
################################################################
################################################################
Callback part
################################################################

if __name__ == '__main__':
    app.run_server(host='0.0.0.0', port=5050, debug=True)
Creation of Layout part
This time I'll try using checkboxes (dcc.RadioItems ()) and buttons (html.Button ()). The sample code is on the Official Site, so I think it's a good idea to find what you want to use and implement it by copying the sample. .. For example, if you look at the sample code of dcc.RadioItems (), it looks like the following.
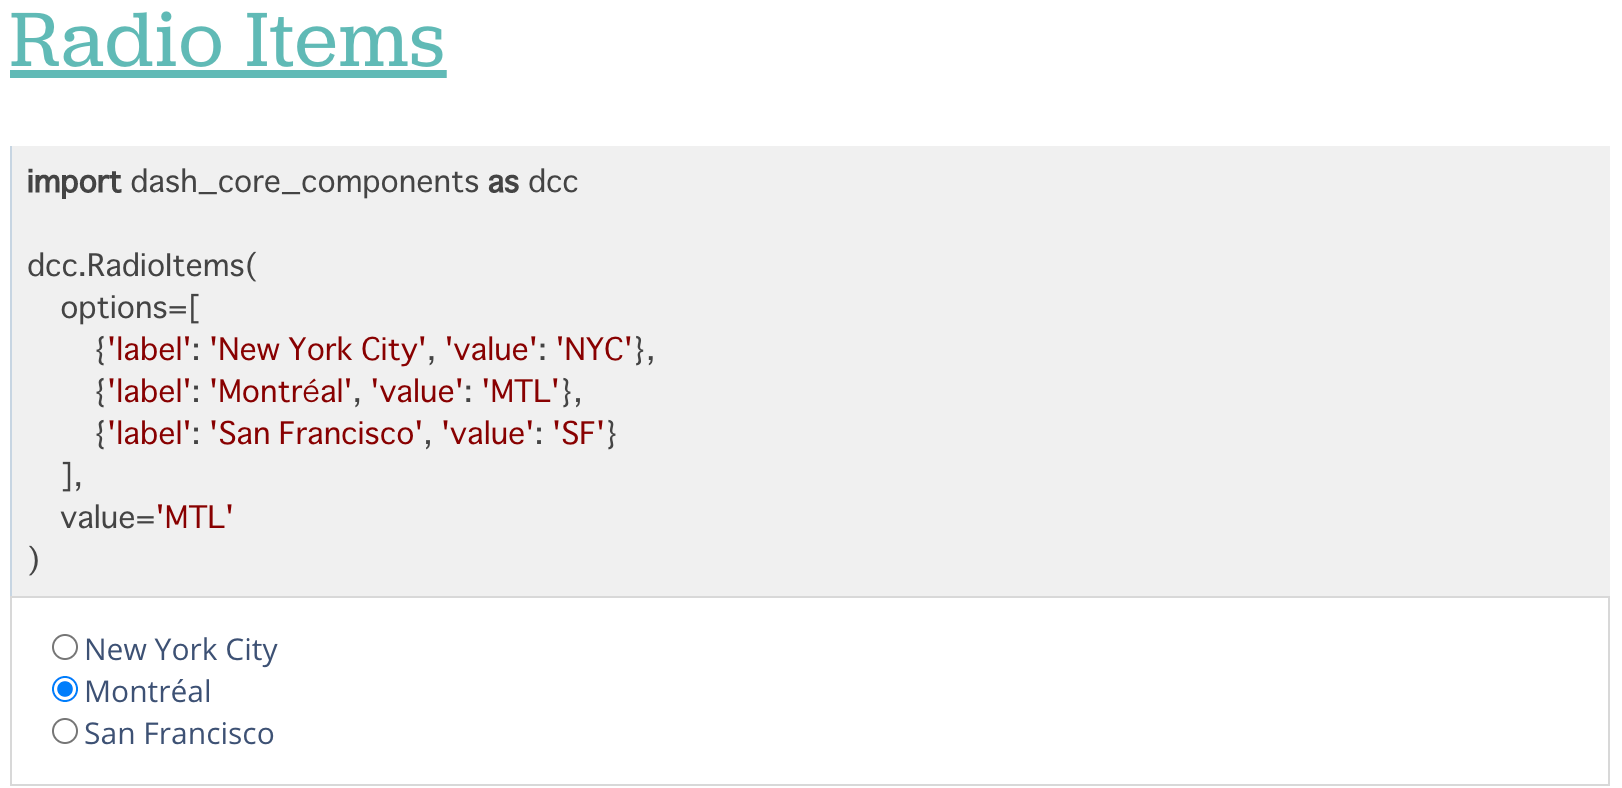 If you take a look, you can see that the options are set with the argument
 options, and label (displayed text) and value are specified for each option. Furthermore, since'Montreal'is checked as a result of specifying'MLT'in the next argument value, the initial value can be set in the argument value, and the value selected by UI operation is value. You can imagine that will be overwritten (although it's much faster to check it while actually moving it than to read it ...).
While imitating the sample code, I created the Layout part as follows. The initial value of value was not set, and the set option value was set to'AAA','BBB', and'CCC' for easy understanding.
app.py
app.layout = html.Div(children=[

    html.H3('Step5:Analysis of numeric variables'),
    html.H5('Select an analysis method and press Execute'),
    #Check box part
    dcc.RadioItems(
        id='num_analysis_selection',
        options=[
            {'label': 'List of statistics', 'value': 'AAA'},
            {'label': 'Pair plot', 'value': 'BBB'},
            {'label': 'Correlation matrix', 'value': 'CCC'}
        ]
    ),
    #Button part
    html.Button(id="num_analysis-button", n_clicks=0, children="Run", style={'background': '#DDDDDD'}),
    #The part that displays the result
    html.Div(id='num_result')
])
If you start the app in this state, it will be displayed as below. Of course, as it is now, nothing happens even if you press the button, so I would like to start moving with Callback from the next section.

Callback part
Operation check
Next, I will write the Callback part. Before using the data, let's start with a simple operation check. Below the Layout part of app.py, write Callback as follows.
app.py
@app.callback(
    Output(component_id='num_result', component_property='children'),
    [Input(component_id='num_analysis_selection', component_property='value')]
)
def num_analysis(input):
    return input
If you run the app in this state, you can see that the value of value of the checked option is displayed under the button. [The above (part2)] This is a review of (), but the movement is as follows: ① The value of value ofdc.ReadItems ()specified in Input is the argument (input) of the function num_analysis () (2) The return value (input) of this function is passed to the argument children of html.Div (id ='num_result') specified in Output.
 After confirming the movement, I would like to use the actually read data. This time, different processing is performed depending on the selected content, so conditional branching is performed with an if statement using the input value.
Drawing Table
First, I will write the processing when "Statistic list" is selected. Specifically, I would like to draw a table of the results of performing the describe () method in Pandas. I've heard how to draw a table with Dash, but here I'll use the simplest html.Table. If you take a look at the Official Tutorial Sample Code,
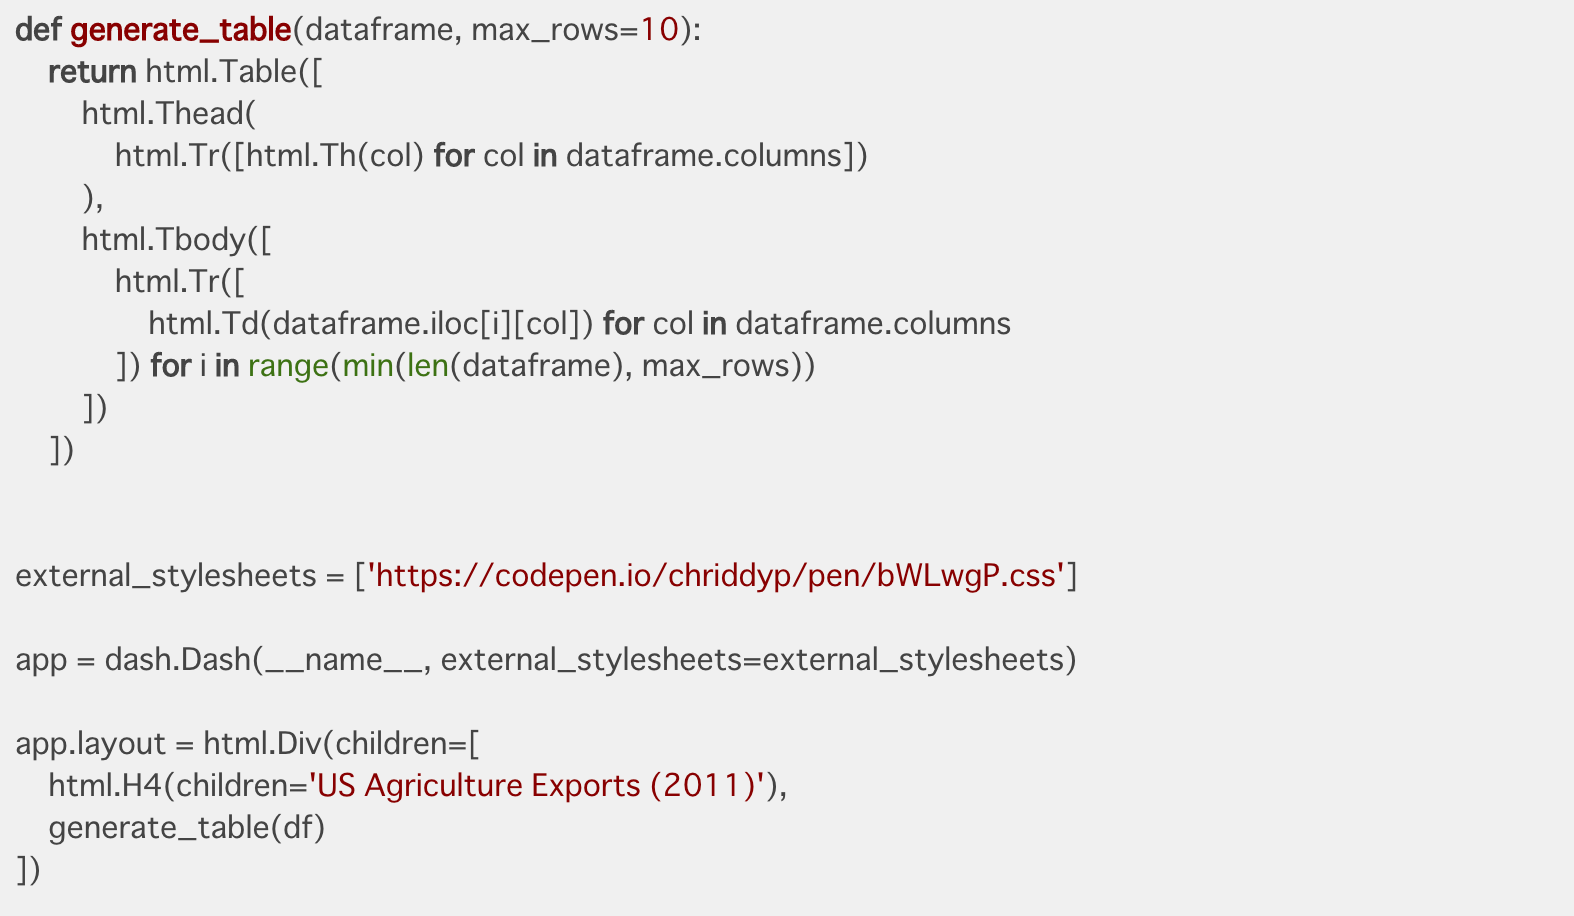 It's a little complicated, but it seems that I'm making a function called
 generate_table (). This time, I implemented it as below using the return part of this function.
app.py
@app.callback(
Output(component_id='num_result', component_property='children'),
[Input(component_id='num_analysis_selection', component_property='value')]
)
def num_analysis(input):
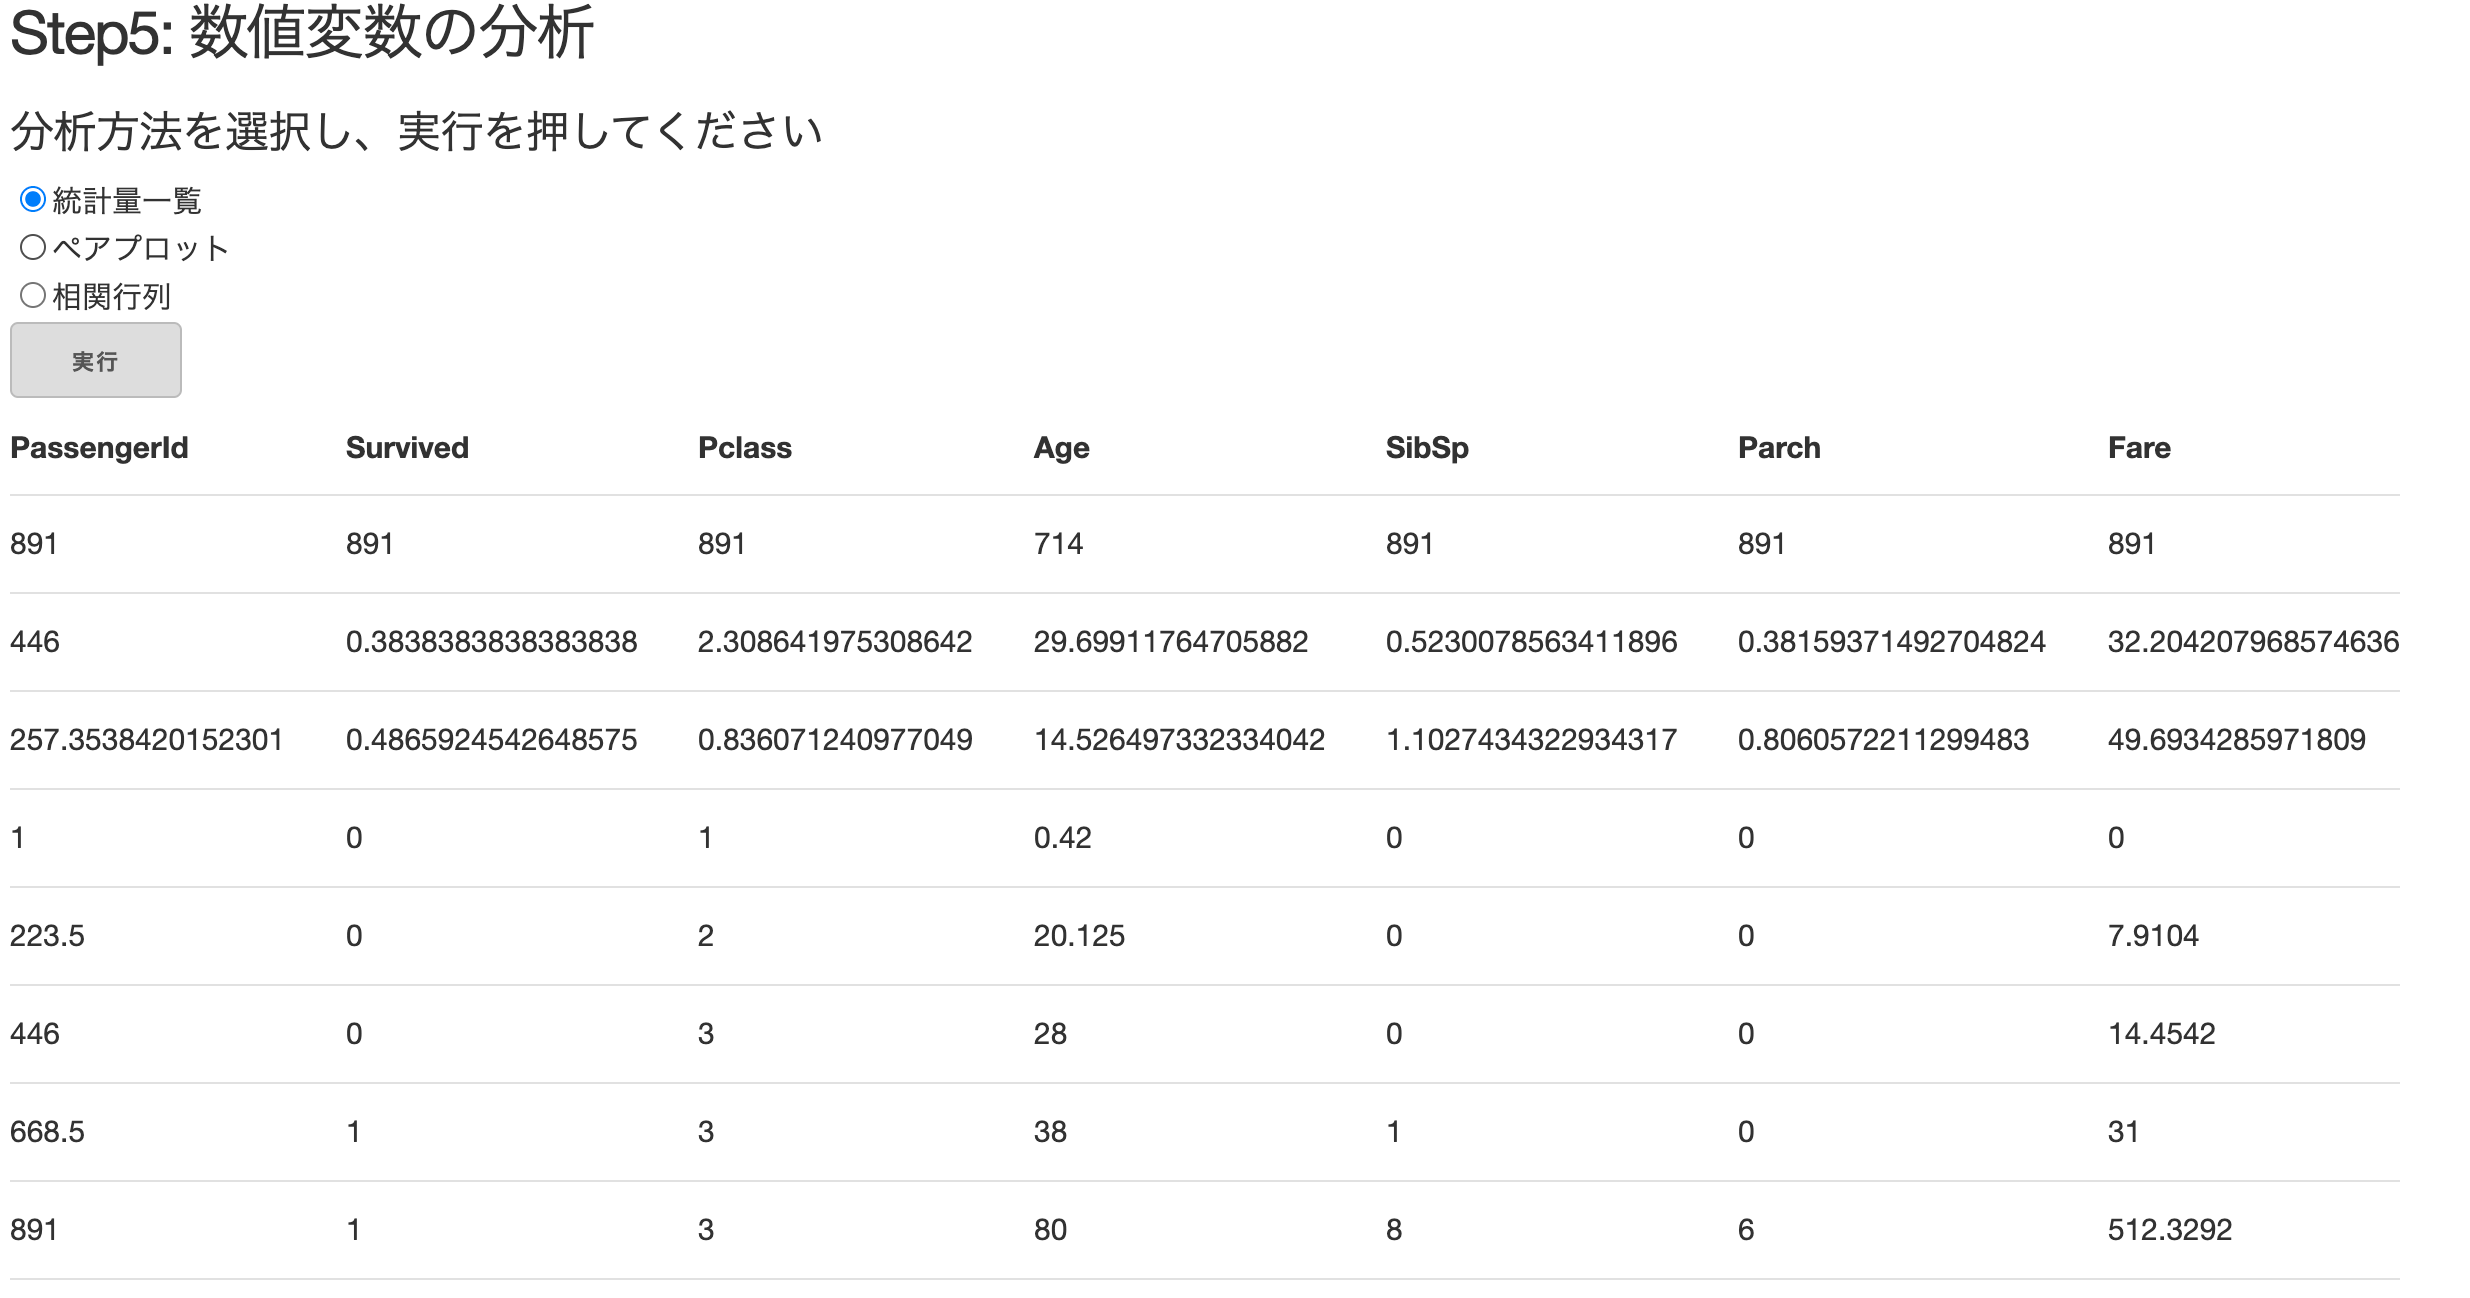
if input == 'AAA':
describe = data.describe()
return html.Table([
html.Thead(
html.Tr([html.Th(col) for col in describe.columns])
),
html.Tbody([
html.Tr([
html.Td(describe.iloc[i][col]) for col in describe.columns
]) for i in range(len(describe))
])
])
If you select "Statistic list", you should be able to draw the table as shown below.
Draw a Plotly diagram
Next, we will implement pair plots and correlation matrix (heat map) drawing. The best thing about Dash is that you can use Plotly's interactive and cool diagrams, so I'll look for it from Plotly's official website. Since the basic flow is the same, we will only look at the pair plot.
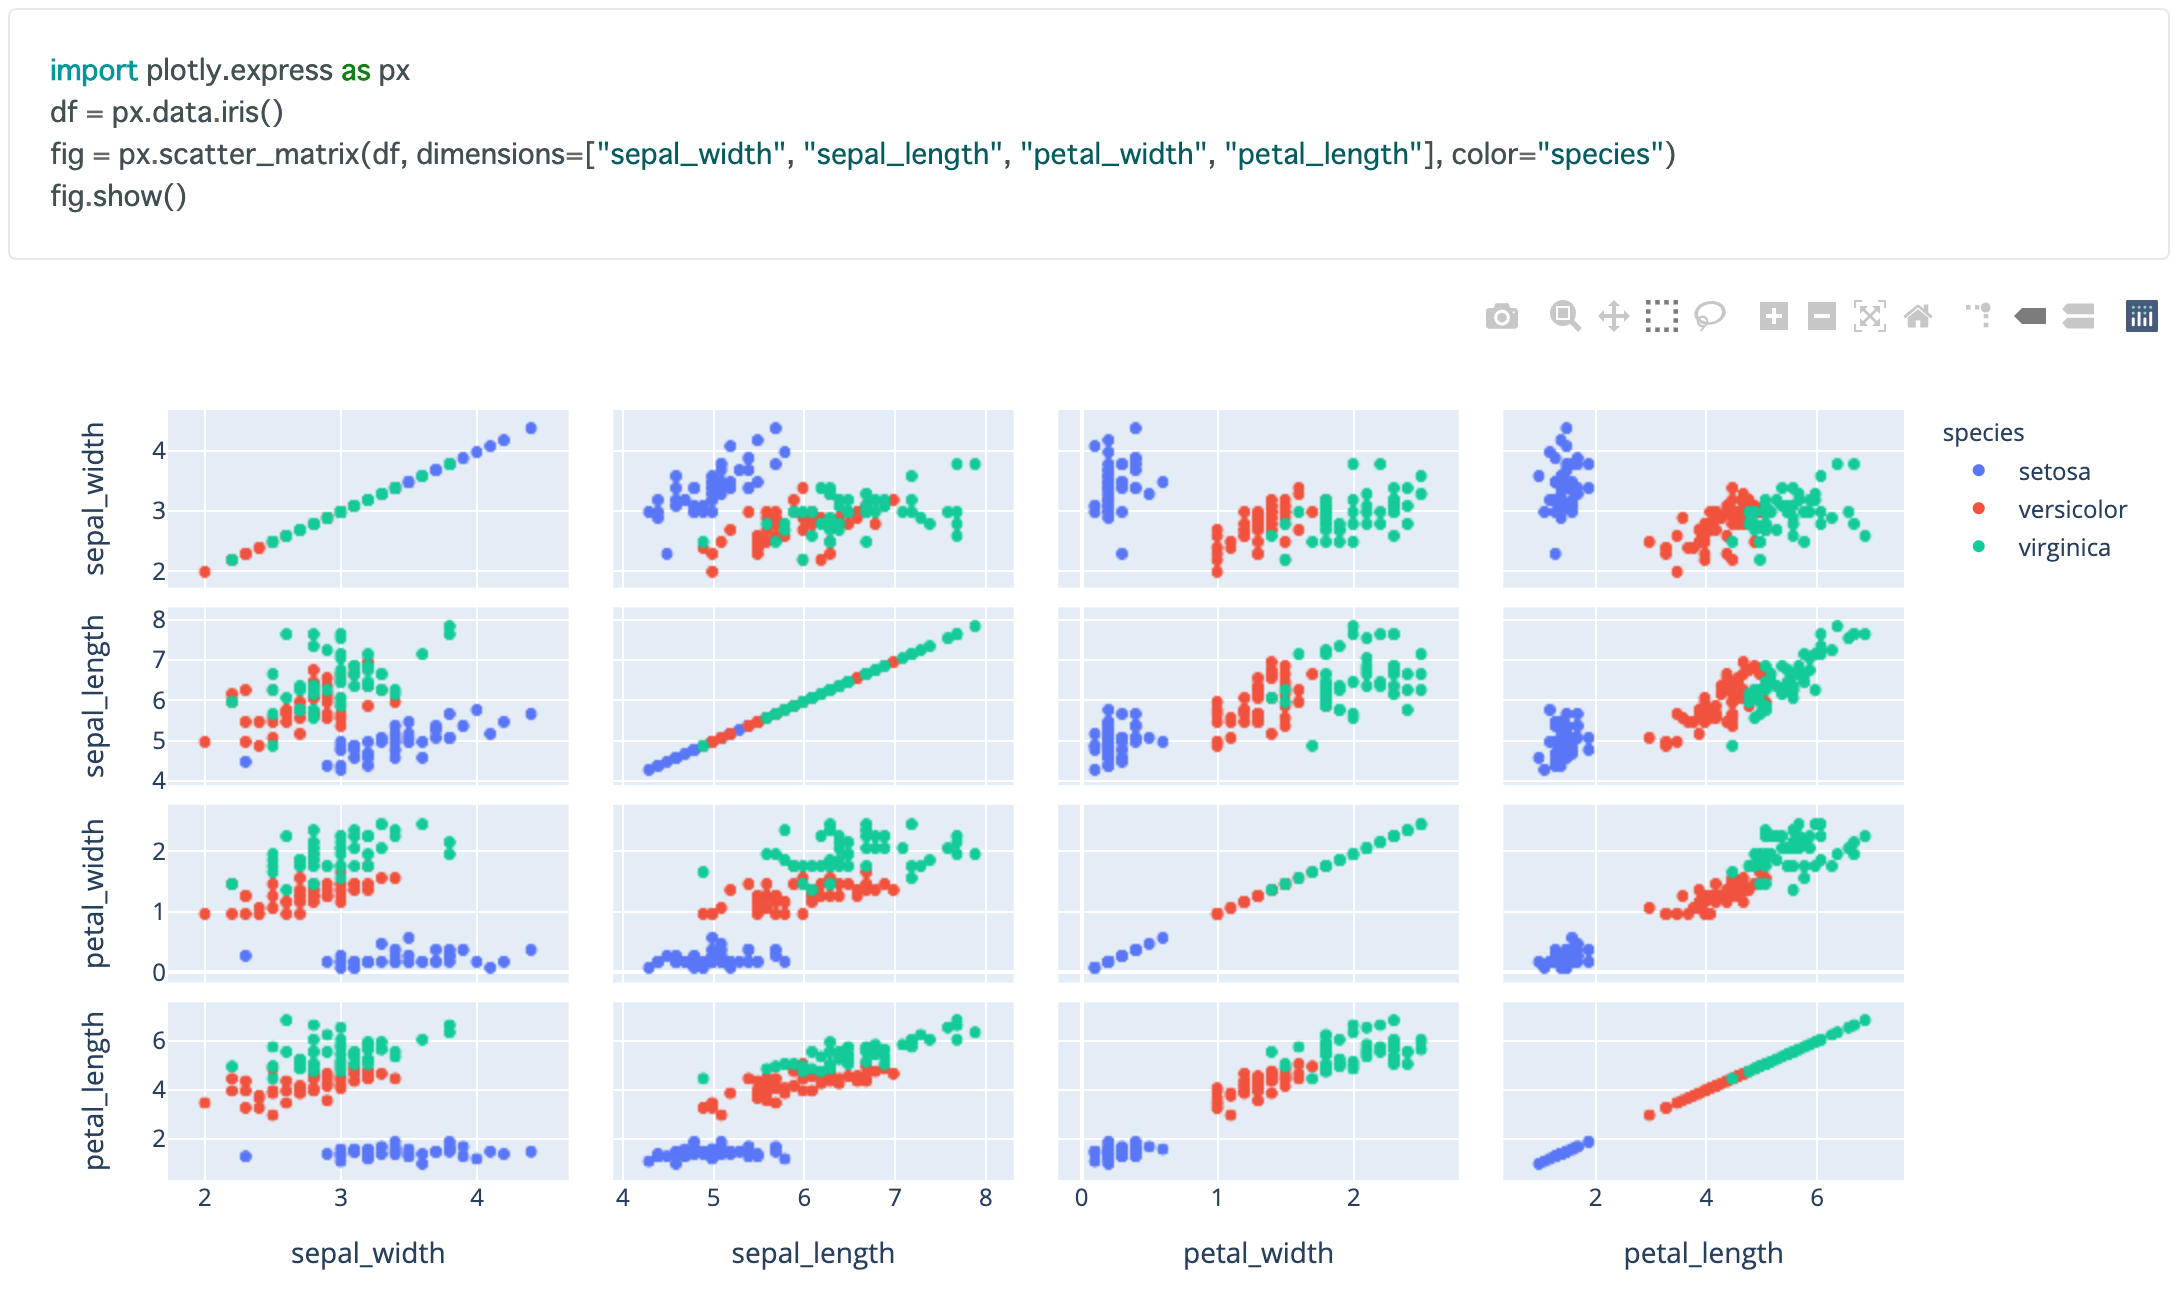 The way to draw a Plotly diagram with Dash is basically to change the
 fig.show () in Plotly to dcc.Graph (figure = fig). Then, we will also implement the heat map part.
app.py
@app.callback(
Output(component_id='num_result', component_property='children'),
[Input(component_id='num_analysis_selection', component_property='value')]
)
def num_analysis(input):
#Drawing a list of statistics
if input == 'AAA':
describe = data.describe()
return html.Table([
html.Thead(
html.Tr([html.Th(col) for col in describe.columns])
),
html.Tbody([
html.Tr([
html.Td(describe.iloc[i][col]) for col in describe.columns
]) for i in range(len(describe))
])
])
#Drawing a pair plot
elif input == 'BBB':
fig = px.scatter_matrix(
data,
dimensions=['Pclass', 'Age', 'Parch', 'Fare'],
color='Survived'
)
return dcc.Graph(figure=fig)
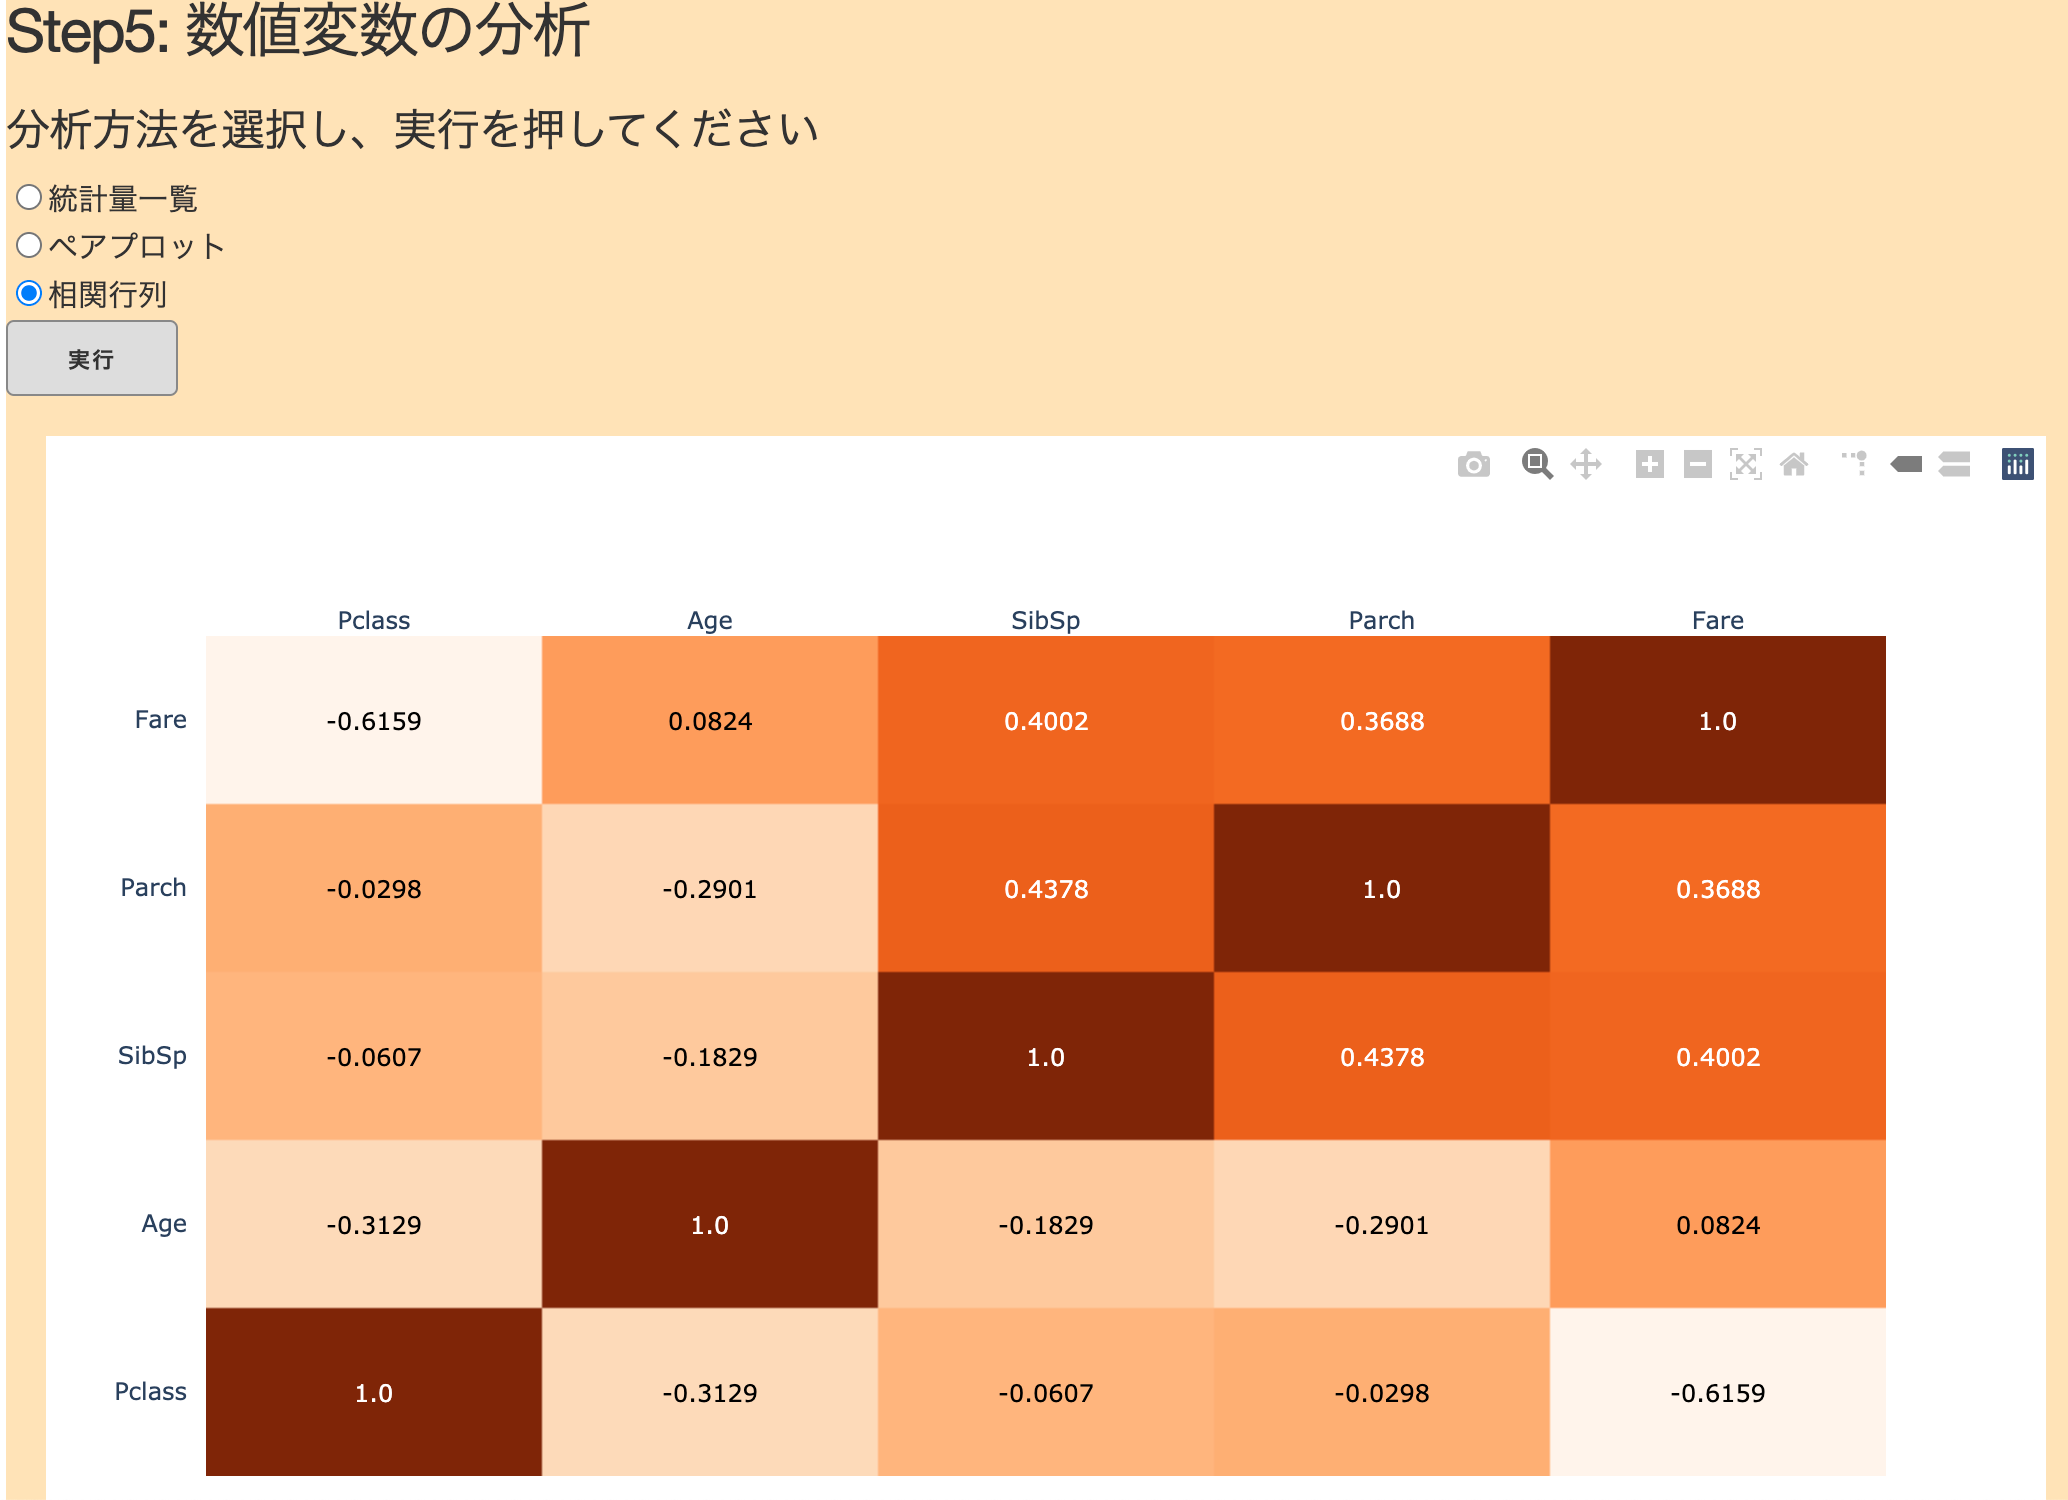
#Drawing of correlation coefficient (heat map)
elif input == 'CCC':
corr = data[['Pclass', 'Age', 'Parch', 'Fare']].corr().round(4)
fig = ff.create_annotated_heatmap(
z=corr.values,
x=list(corr.columns),
y=list(corr.index),
colorscale='Oranges',
hoverinfo='none'
)
return dcc.Graph(figure=fig)
You should now be able to draw pair plots and correlation matrices as well.
Use State to make buttons work
One last step. At this time, the moment you select the checkbox, the drawing starts drawing and the run button below is not working. We will modify this so that the result will be reflected by pressing the execute button after selecting it. To do this, we will use a function called State in Callback. Comment out the if statement and below once, and modify the Callback part as shown below.
app.py
@app.callback(
Output(component_id='num_result', component_property='children'),
[Input(component_id='num_analysis-button', component_property='n_clicks')],
[State(component_id='num_analysis_selection', component_property='value')]
)
def num_analysis(n_clicks, input):
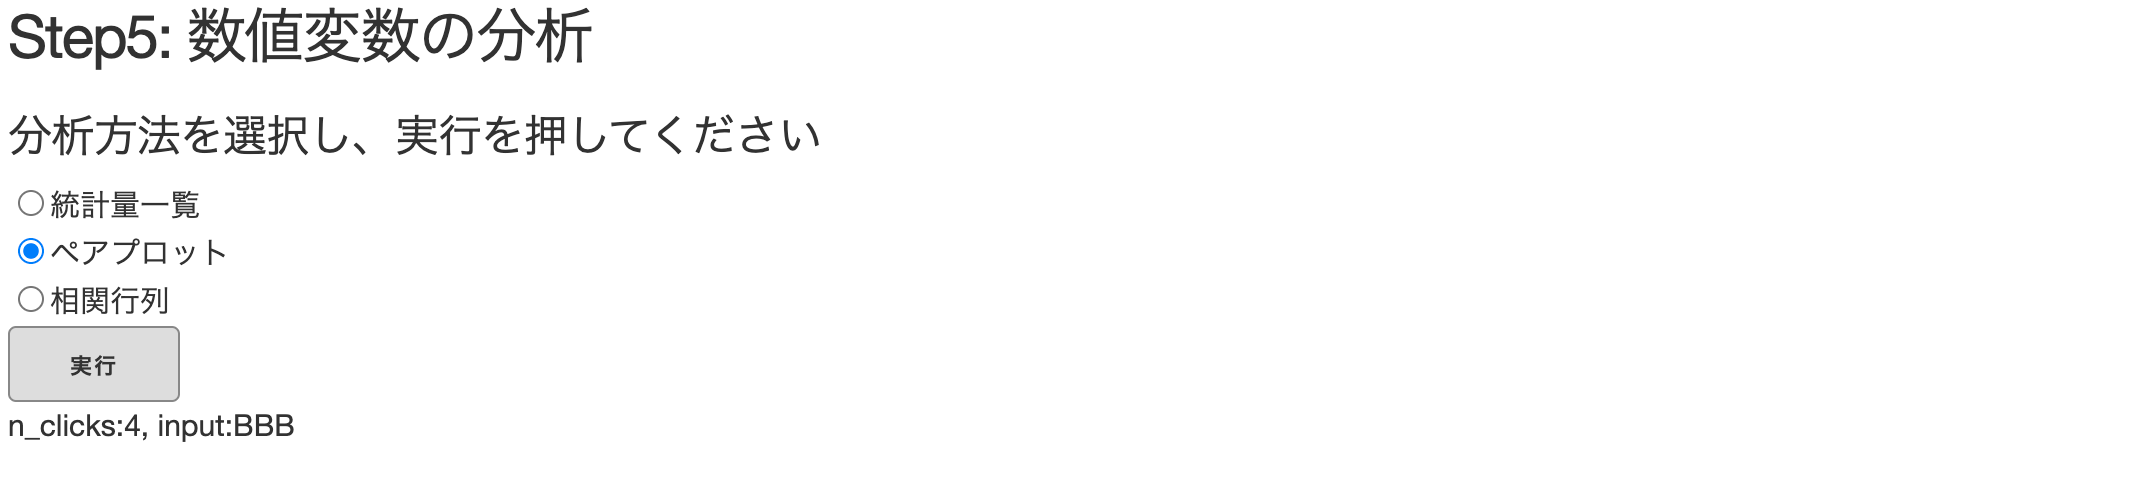
return 'n_clicks:{}, input:{}'.format(n_clicks, input)
I specified a button for Input and rewrote the checkbox that was originally Input to State. By doing this, the part specified by State will not be reflected when there is an action, but will be reflected at the same time when there is an action in the part specified by Input. Note that there are two arguments passed to the function, one from the button (n_clicks) and one from the checkbox (input). By the way, n_clicks is the number of times the button was pressed. If you start the app in the above state as a trial, the value of n_clicks will increase each time you press the execute button, and you can see that the input contains'AAA'etc.
 Now that you understand how State works, return the contents of the
 num_analysis (n_clicks, input) function to the if statement and below. I don't use n_clicks this time, so that's it. Finally, I will post the completed code again.
app.py
import dash
import dash_core_components as dcc
import dash_html_components as html
from dash.dependencies import Input, Output, State
import pandas as pd
import plotly.express as px
import plotly.figure_factory as ff

external_stylesheets = ['https://codepen.io/chriddyp/pen/bWLwgP.css']

data = pd.read_csv('src/dash/titanic_train.csv')

app = dash.Dash(__name__, external_stylesheets=external_stylesheets)

app.layout = html.Div(children=[

    html.H3('Step5:Analysis of numeric variables'),
    html.H5('Select an analysis method and press Execute'),
    #Check box part
    dcc.RadioItems(
        id='num_analysis_selection',
        options=[
            {'label': 'List of statistics', 'value': 'AAA'},
            {'label': 'Pair plot', 'value': 'BBB'},
            {'label': 'Correlation matrix', 'value': 'CCC'}
        ]
    ),
    #Button part
    html.Button(id="num_analysis-button", n_clicks=0, children="Run", style={'background': '#DDDDDD'}),
    #The part that displays the result
    html.Div(id='num_result')
])
@app.callback(
    Output(component_id='num_result', component_property='children'),
    [Input(component_id='num_analysis-button', component_property='n_clicks')],
    [State(component_id='num_analysis_selection', component_property='value')]
)
def num_analysis(n_clicks, input):
    if input == 'AAA':
        describe = data.describe()
        return html.Table([
            html.Thead(
                html.Tr([html.Th(col) for col in describe.columns])
            ),
            html.Tbody([
                html.Tr([
                    html.Td(describe.iloc[i][col]) for col in describe.columns
                ]) for i in range(len(describe))
            ])
        ])
    #Drawing a pair plot
    elif input == 'BBB':
        fig = px.scatter_matrix(
            data,
            dimensions=['Pclass', 'Age', 'Parch', 'Fare'],
            color='Survived'
        )
        return dcc.Graph(figure=fig)

    #Drawing of correlation coefficient (heat map)
    elif input == 'CCC':
        corr = data[['Pclass', 'Age', 'Parch', 'Fare']].corr().round(4)
        fig = ff.create_annotated_heatmap(
            z=corr.values,
            x=list(corr.columns),
            y=list(corr.index),
            colorscale='Oranges',
            hoverinfo='none'
        )
        return dcc.Graph(figure=fig)


if __name__ == '__main__':
    app.run_server(host='0.0.0.0', port=5050, debug=True)
in conclusion
As a practical version, we have implemented a simple table data analysis application. When making an application for machine learning or data analysis, most of the work is repeated like this time, "Processing data with Pandas or Scikit-learn → Passing values to match Dash or Plotly", so various things Please try. In the next article (last), I'd like to show you how to deploy your app to Heroku using Docker. It's been a long time, but thank you.
Recommended Posts