Use PyCaret to predict the price of pre-owned apartments in Tokyo!
§ What is PyCaret? </ strong>
I would like to introduce the steps to predict the price of a pre-owned condominium by creating a prediction model using PyCaret , which is now a hot topic on Twitter etc. think.
PyCaret allows you to perform a series of machine learning steps such as creating predictive models, tuning, and making predictions with a minimum of Python code. It becomes.

In this article, what is machine learning through Pycaret for those who are about to start machine learning? I would like to proceed while introducing that. Please note that there may be expressions that differ from the strict definition, as we emphasize sensory comprehension.
Now, with this PyCaret , you can execute various processes required to create a predictive model for machine learning with a simple code. It's an excellent product that gives you, and how convenient it is to use it! I was surprised with. And it's free </ strong>!
But, however. If you don't understand the difficulty of the machine learning process in the first place, you may not appreciate it.
§ What is supervised machine learning? </ strong>
Creating a predictive model and improving its accuracy is a really difficult task.
First of all, I would like to review the necessary work for "supervised machine learning" </ strong>.
In supervised machine learning, some rule (model) is derived based on past data for which the result (answer) is known, and the result to be known is predicted by applying the rule.
For example, if you have a set of property conditions and prices for a second-hand condominium in the past, you can predict the price if you know the conditions such as where the nearest station is, how many square meters it is, and how many years it was built. Let the machine make this rule using various algorithms. This is machine learning.
The steps of supervised machine learning are roughly divided as follows.
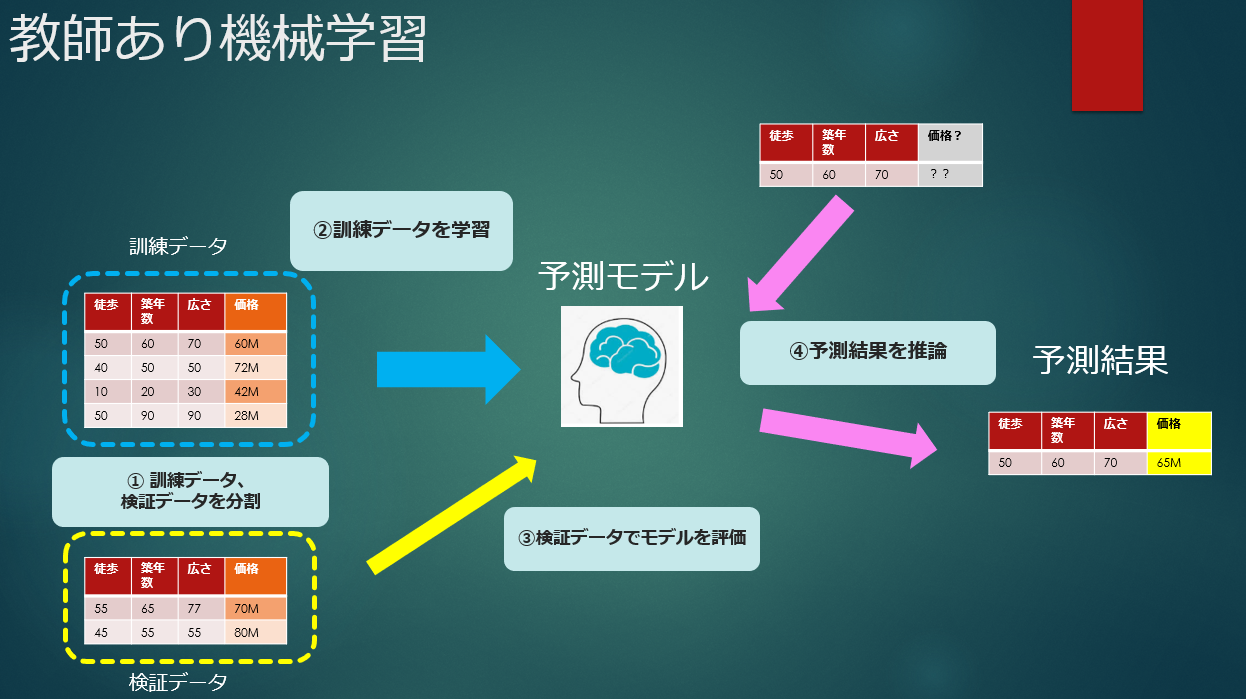
① Divide the data into training data and verification data </ b>
Divide the data into training data and validation data to validate the model with data that is not used to train the model. If you evaluate it with training data, it's like cheating. Normally, in order to use the training data and the data that verifies the accuracy of the model evenly and fairly, it is divided and alternately replaced (cross-validation).
② Model creation (learning) and hyperparameter tuning </ b>
The algorithm used for prediction is decided, trained using training data, a model is created, and tuning is performed to improve accuracy.
③ Model evaluation </ b>
Evaluate the accuracy of the model created by training and evaluate how much error it has and how useful it is.
④ Prediction of unknown values </ b>
After the evaluation is completed, the prediction result is obtained by inputting the data whose result is unknown to the prediction model. I only know the conditions of the condominium property, but I don't know the price, so the image is to predict it.
§ Actually try using PyCaret.
Now let's carry out this flow using Pycart.
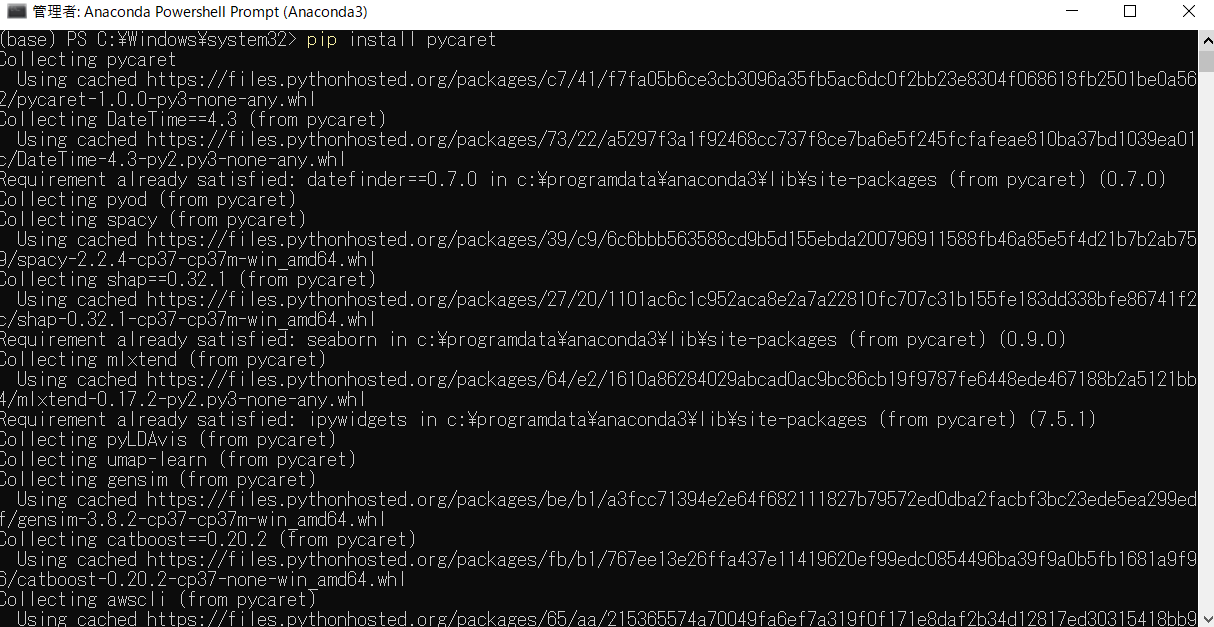
First, let's install pycaret with pip.
This time I'm running pip from Anaconda Powershell.
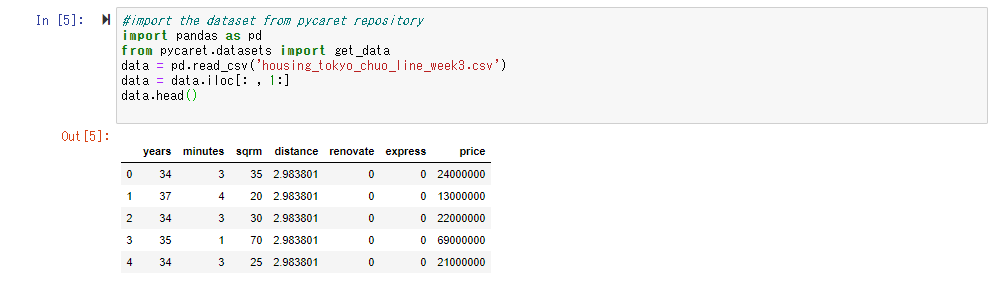
First, let's read the data. This time as well, the price of the used condominium along the Tokyo Chuo Line used in "Data Science Cram School Starting with Tableau" Use the data as teacher data. The data itself has the following contents.
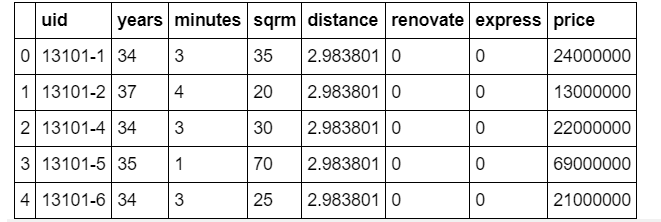
The explanation of each item is as follows.
| Item name | Description | Data type |
| uid | Unique ID of the property | String type |
| years | Age | Integer type |
| minutes | Walking distance (minutes) from the nearest station | Integer type |
| sqrm | Number of square meters of property | Integer type |
| distance | Straight line distance between Tokyo Station and the nearest station (how far is it from the city center?) | floating point |
| renovate | Refurbished flag | Integer type (0 or 1) |
| express | Flag to see if the express stops | Integer type (0 or 1) |
| price | Transaction price (objective variable) | Integer type (unit: 1 yen) |
Call Pycaret with import. Since this is a regression model that guesses the price, import it from pycaret.regression.
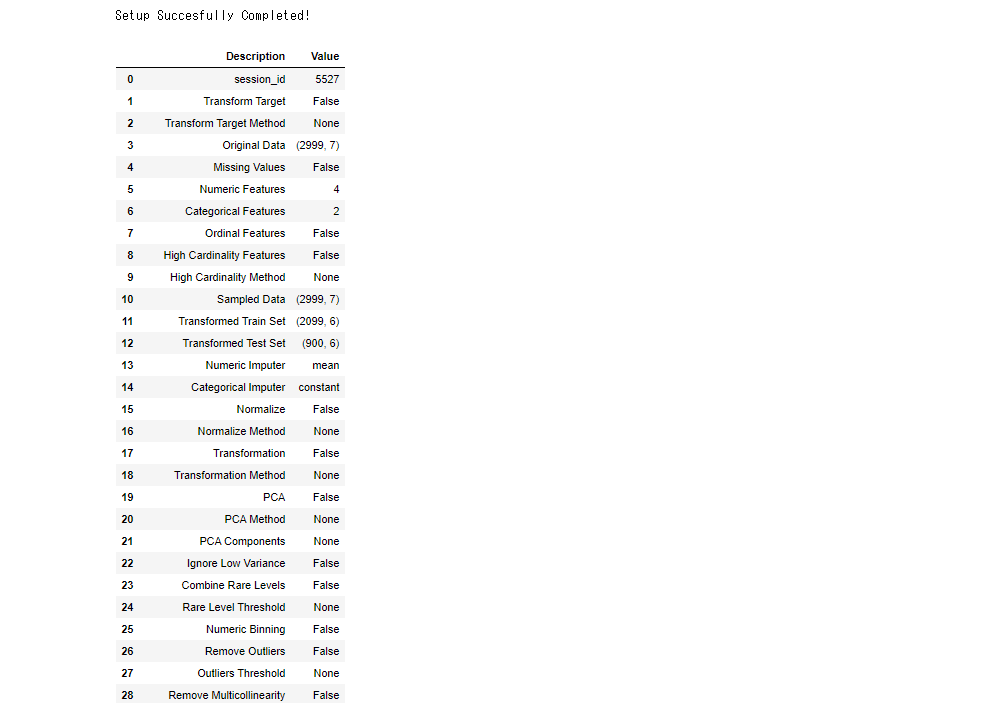
If you set the objective variable (variable you want to predict) to the apartment price "price" and execute the Setup () function, it will automatically determine whether each field is a numeric column or a category column, and if there is no difference, Execute the return key.
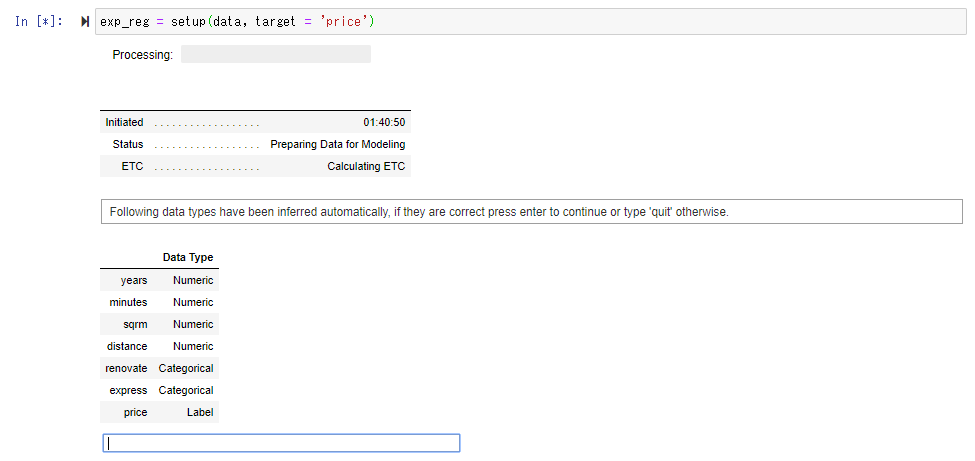
Perform the necessary pretreatment.
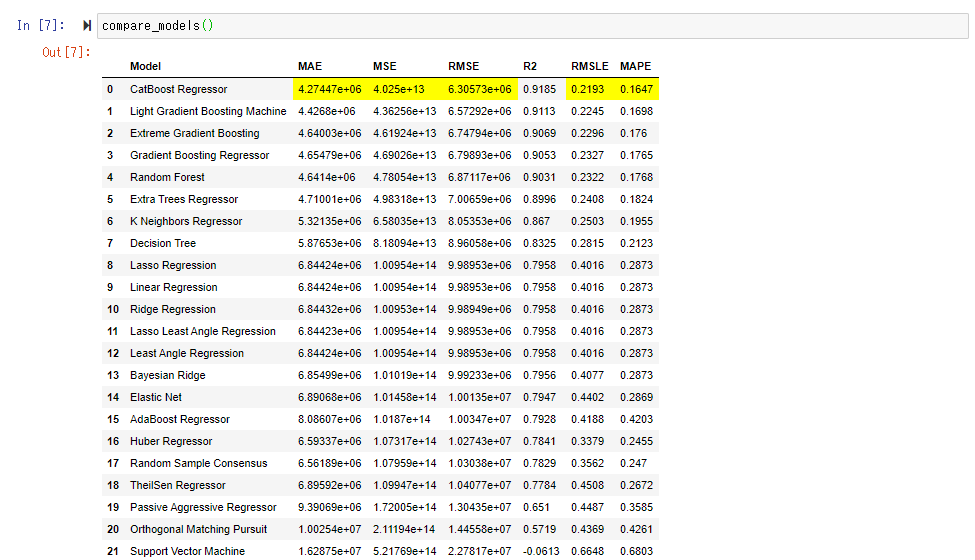
Compare_model () evaluates and compares various models and arranges them in order of least error. Internally, cross-validation (the teacher data and the verification data are exchanged evenly and evenly) is carried out, and by default, Fold = 10 (the data is divided into 10 and the training data and the verification data are exchanged). The average score is displayed.
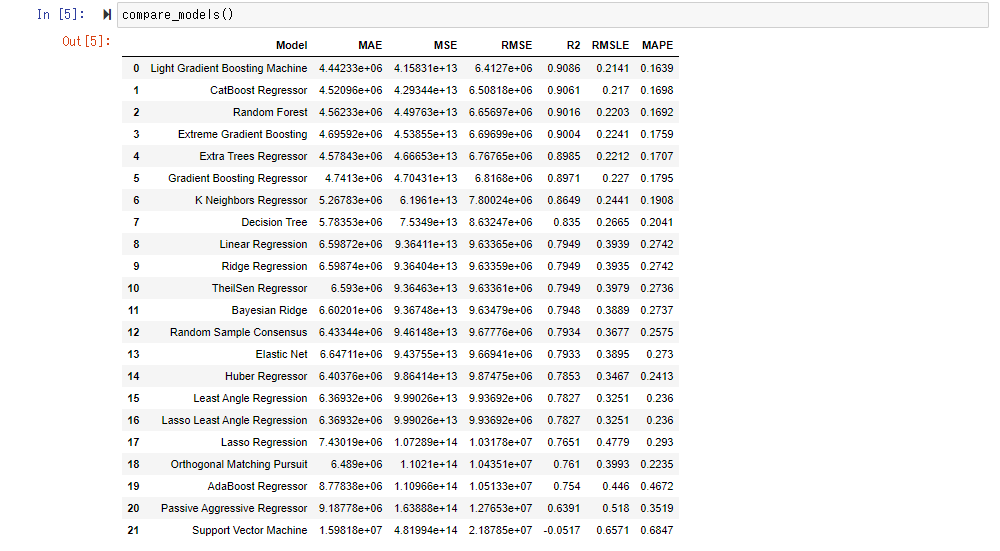
This time, the score of " CatBoost Regressor " seems to be good. Since RMSE is 6.3 million, you may roughly understand that the average error per condominium is about 6.3 million.
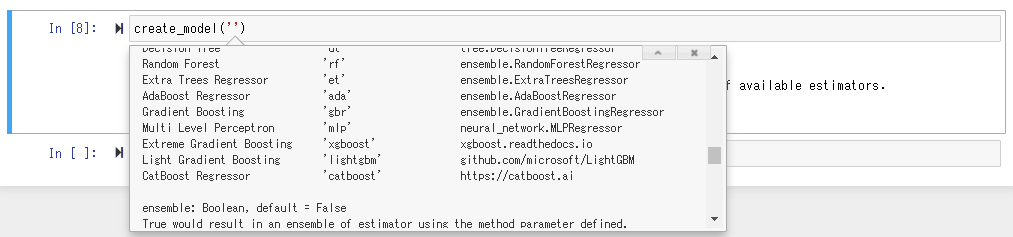
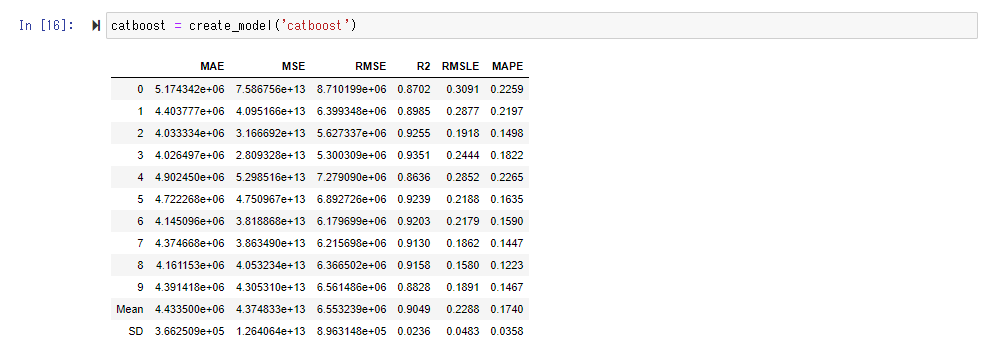
Execute the create_model () function to use the actually trained model. Shift + Tab will guide you on what to put in the argument, but here we will specify the "Cat Boost Regressor" with the best score.
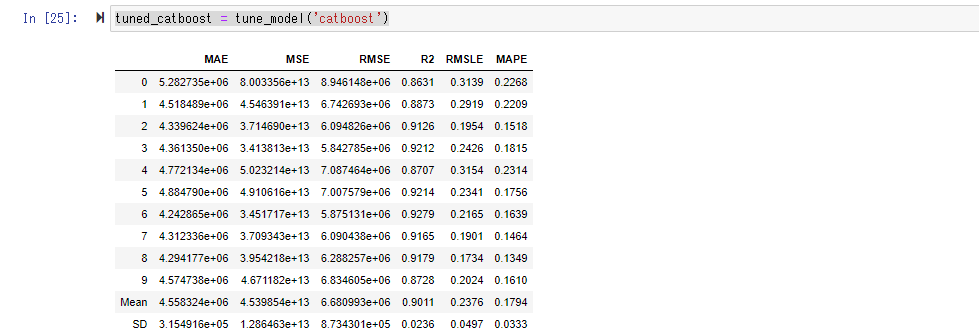
When you create a model with tune_model (), the hyperparameters (predetermined parameters for model behavior before training) are left at their defaults. Find the appropriate hyperparameters in the preset range. It seems that Random Search is used here as the best parameter search method.
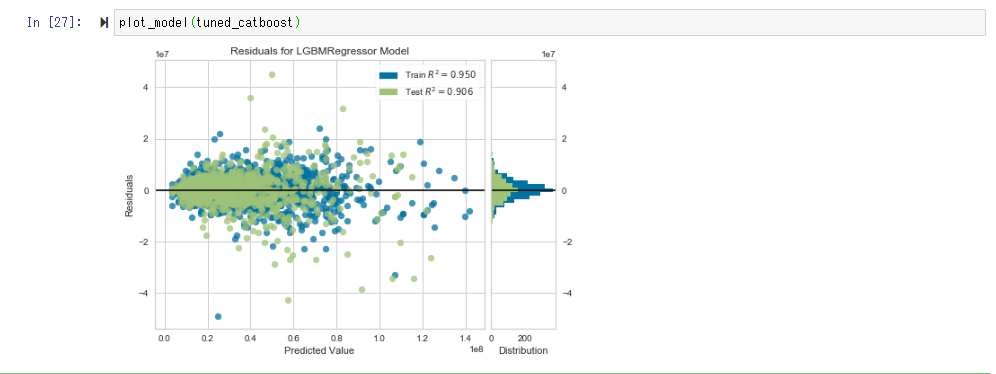
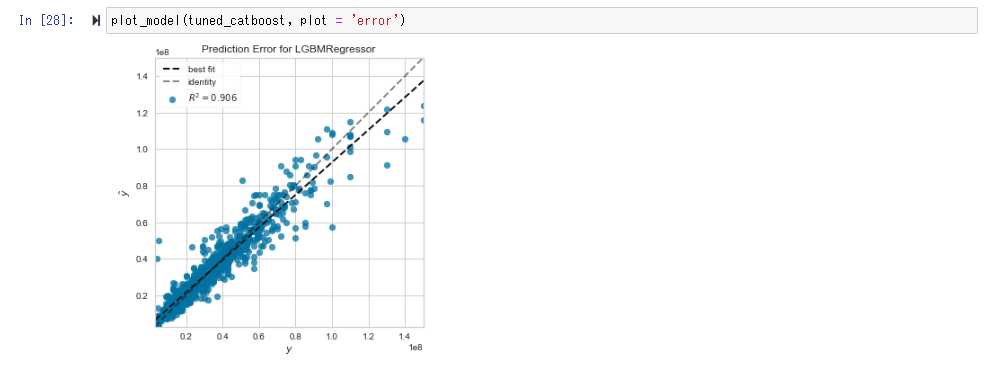
Visualize and check the accuracy of the model with plot_model ().
In Error Plot, if the prediction and the measurement are equal, the distribution approaches the straight line of y = x.
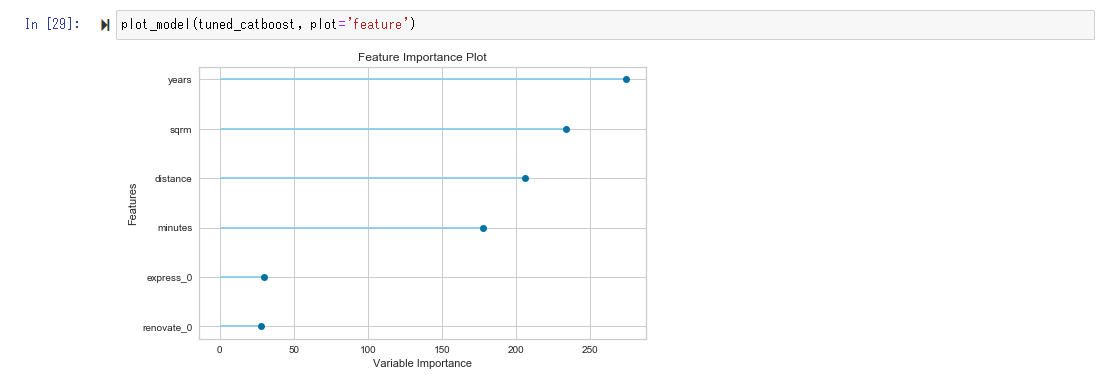
The Feature Importance Plot sees which variables are strongly involved in the prediction. In this case, you can see that the influence is strong in the order of age (years), square meter (sqrm), distance (straight line distance from Tokyo station to the nearest station), minutes (minutes on foot from the nearest station).
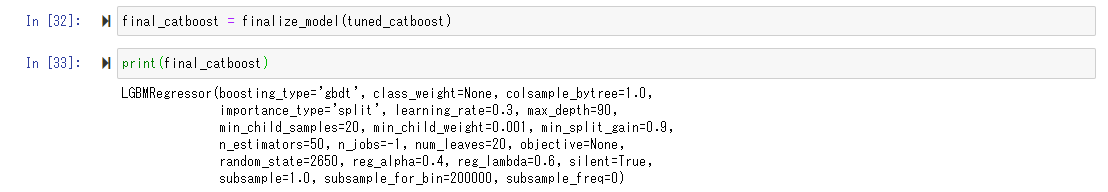
Finally, execute finalize_model () to finalize the model. You can see the optimized hyperparameters by printing here.
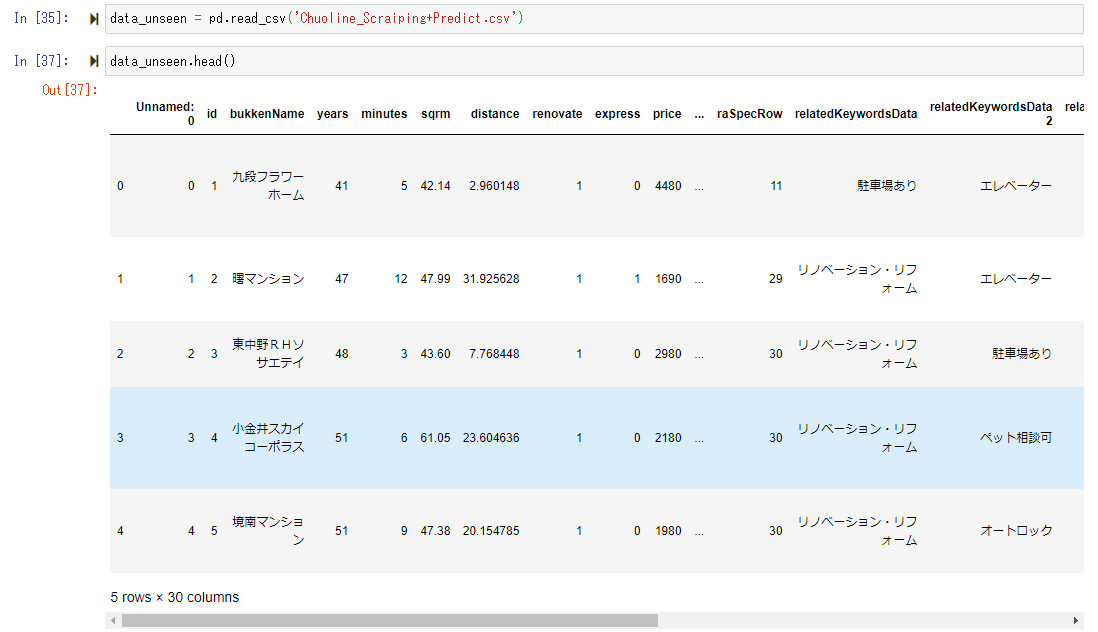
Now that we have a trained model, we need to prepare the apartment price information scraped from the real estate page on the web, which is used to create the model, and put it in the data frame named "data_unseen".
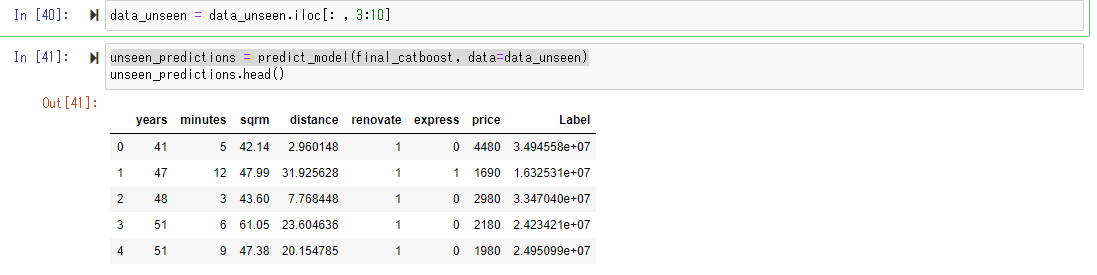
Let's put this "unseen_data" into the forecast model we just created and let it predict the price.
This operation is very easy, cut out the explanatory variables in the same form as the training data, and use the predict_model () function to calculate the predicted value.
Below, you can see that the predicted value has been added as "Label". Originally, for unknown data, we do not know the objective variable "price", but this time we have the price of the condominium already published on the Web, so "price" is included in the data. (However, the unit of public information is 10,000 yen.) Comparing the "price" published on this Web with the predicted value "Label" predicted by the prediction model, it is a relatively good value. You can feel that it is coming out. (Approximately 20-40 million seems to be in the range of apartment prices in Tokyo.)
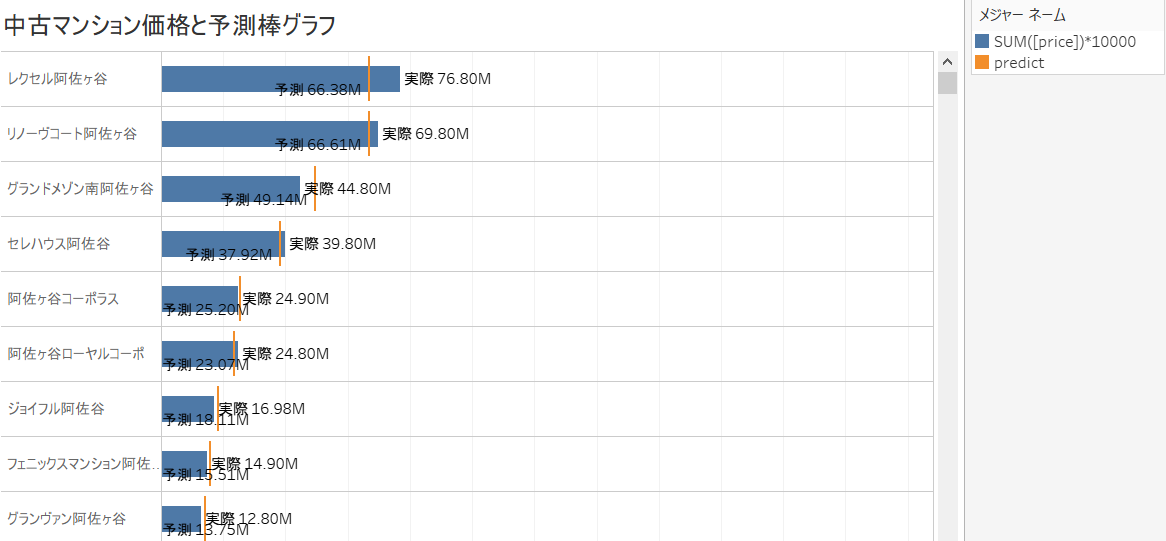
This data can be dropped to CSV, so drop it to CSV and then connect it to Taleau for visualization.
If you compare the published price "price" on the Web with the "Label" calculated by the forecast model, you may find a "bargain property" whose actual price is cheaper than the forecast, and vice versa. Hmm. (Hereafter, the usage of the estimated price in Tableau is the same as this link.)
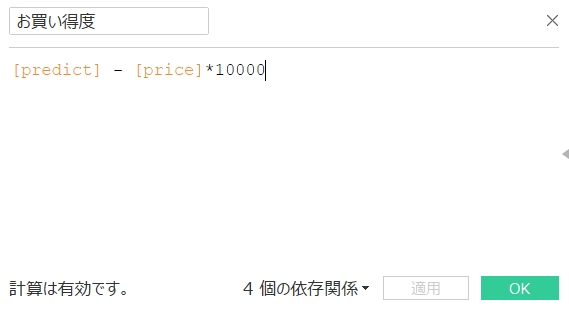
If the bargain price is defined as a calculated field as shown below and the predicted price is higher than the posted price, the bargain price is actually higher than expected because it is "cheaper than expected!" , Actually, it is "higher than I expected!", So I will try to reduce the bargain.
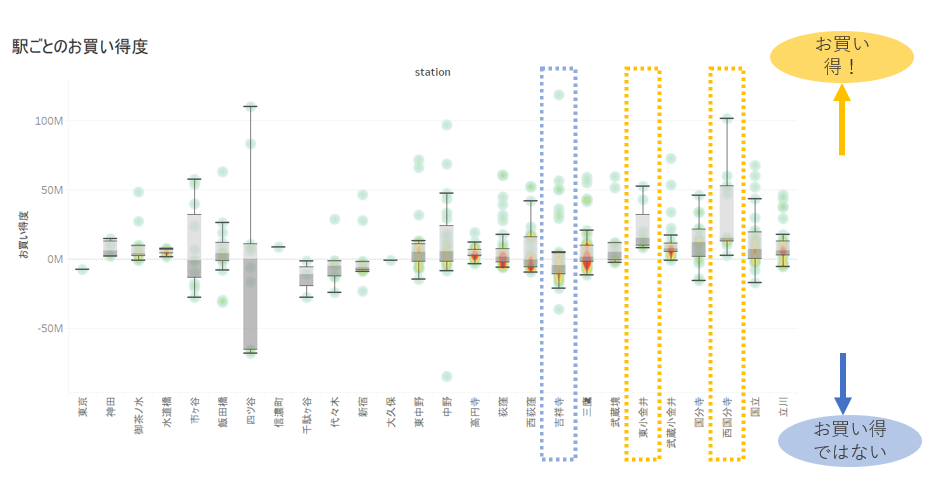
If you draw a box plot for each station and visualize it, it will be as follows.
There are discoveries such as Yotsuya is too wide and unreliable, Kichijoji has a low bargain, Nishi-Kokubunji has a high bargain.
This suggests that in addition to the explanatory variable of the distance from Tokyo Station to the nearest station (how close to the city center), there is no explanation unless new factors such as "popularity of the nearest station" are taken into consideration. You may get it. (* Note: Whether it is an actual bargain or not depends on individual values, and the article is written on the premise that it cannot be judged unconditionally.)
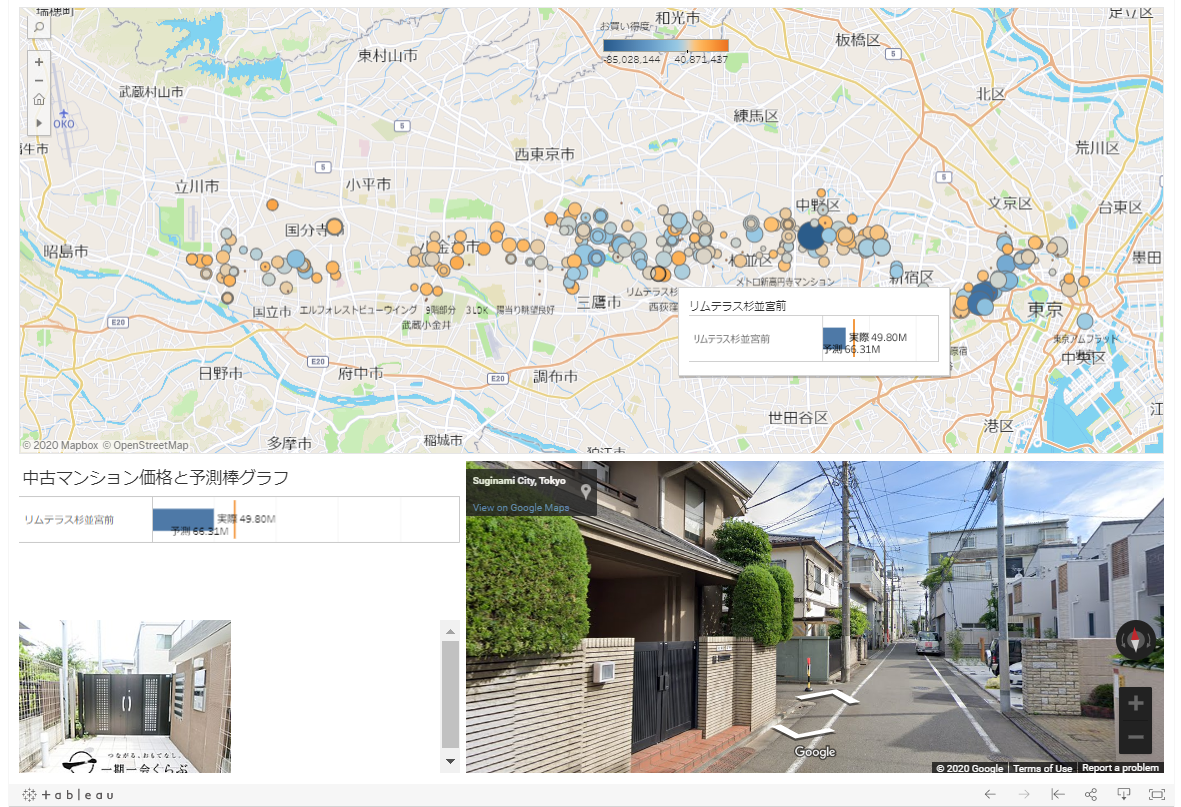
In addition, as a further development of data utilization, latitude and longitude are geocoded from scraped data and bargain properties are mapped on a map. Below, orange means that the property is a bargain, blue means that it is not a bargain, and the size of the circle is the price of the property. By clicking the point of the property on the map, you can check the image information of the property and the state of the surrounding city in cooperation with Google Street View. Of course, it is not posted here, but it is also possible to display the property information in the dashboard by linking to the posted web page.
As mentioned above, with PyCaret, the process that is originally required for model creation in machine learning is executed entirely, so it is easy to create predictive models and hyperparameters with almost no need for Python coding or debugging. It was a shock to be able to tune (for free).
Even if you tune in Python for more accuracy, you can significantly reduce the initial workload by using Pycaret as a starting point.
However, it seems that it is still necessary to understand the minimum knowledge of Pandas and the basic method of what is being implemented as a flow of machine learning.
In addition, the value of forecast data can be doubled by visualizing errors with Tableau, etc., collating them with domain knowledge, considering adding new explanatory variables, and utilizing forecast results in an interactive dashboard. Isn't it possible?
In addition to the ensemble, PyCaret seems to be able to perform classification, clustering, anomaly detection, natural language processing, and association analysis for the regression that we have taken up this time, so please add practical examples that you will use in the future. I think
Classification Regression Clustering Anomaly Detection Natural Language Processing Association Rule Mining
Please give it a try.
References:
Qiita article:
Recommended Posts