Data analysis starting with python (data preprocessing-machine learning)
Introduction
For beginners, I would like to explain from data preprocessing in python to machine learning model construction. Use gradient boosting for machine learning.
Source code https://gitlab.com/ceml/qiita/-/blob/master/src/python/notebook/first_time_ml.ipynb
Contents of this article
table of contents
-
- Data preprocessing 1-1. Data reading 1-2. Data combination 1-3. Defective land complement 1-4. Feature creation 1-5. Data split
- Machine learning 2-1. Dataset creation and model definition 2-2. Model training and evaluation 2-3. Confirm the importance of features
About the dataset
・ Provided by: California Institute of Technology ・ Contents: Test data of heart disease patients ・ URL: https://archive.ics.uci.edu/ml/datasets/Heart+Disease ・ Processed.cleveland.data, reprocessed.hungarian.data, reprocessed.hungarian.data, processed.switzerland at the above URL
- See below for data download Data analysis starting with python (data visualization 1) https://qiita.com/CEML/items/d673713e25242e6b4cdb
Analysis purpose
The dataset classifies the patient's condition into five classes. Let machine learning predict these five classes. Machine learning models use gradient boosting.
1. Data preprocessing
1.1 Reading data
import pandas as pd

columns_name = ["age", "sex", "cp", "trestbps", "chol", "fbs", "restecg", "thalach", "exang", "oldpeak","slope","ca","thal","class"]

cleveland = pd.read_csv("/Users/processed.cleveland.data",header=None, names=columns_name)
hungarian = pd.read_csv("/Users/reprocessed.hungarian.data",sep=' ',header=None, names=columns_name)
va = pd.read_csv("/Users/processed.va.data",header=None, names=columns_name)
switzerland = pd.read_csv("/Users/processed.switzerland.data",sep=",",header=None, names=columns_name)
The sep given as an argument in hubgarian and switzerland is a character delimiter. Since all the data in these two data are contained in one column, they are separated for each column by sep.
- Please refer to the data download reference article for column details.
1-2. Data combination
All data can be combined and handled at once.
merge_data = pd.concat([cleveland,hungarian,va,switzerland],axis=0)
print(merge_data.shape)

# output
'''(921, 14)'''
1-3. Complementing deficient land
In this data,'? Since'is entered, convert it to null and then convert the data to numeric type. This time we're using gradient boosting, so we'll just use the null value without converting it, but for other models you'll have to replace null with some number.
merge_data.replace({"?":np.nan},inplace=True)
merge_data = merge_data.astype("float")

#Delete row missing class
merge_data.dropna(subset=["class"], inplace=True)

#Missing value confirmation
print(merge_data.isnull().sum())

# output
'''
age           0
sex           0
cp            0
trestbps     58
chol          7
fbs          82
restecg       1
thalach      54
exang        54
oldpeak      62
slope       119
ca          320
thal        220
class         0
dtype: int64
'''
1-4. Feature creation
This is the step to create a new feature from the feature. Normally, I would skip this step first and create a model using only the collected data. Based on the accuracy there, we will create new features to improve the accuracy. This time I will create it from the beginning because it is a tutorial. As an example, create the difference from the average age as a feature.
merge_data['diff_age'] = merge_data['age'] - merge_data['age'].mean()
1-5. Data division
Divide the data into three parts: train, test, and validation. One thing to keep in mind at this time is that the pathological classes are imbalanced. Let's look at it concretely.
import matplotlib.pyplot as plt
import seaborn as sns
sns.set()

merge_data["class"].hist()
plt.xlabel("class")
plt.ylabel("number of sample")
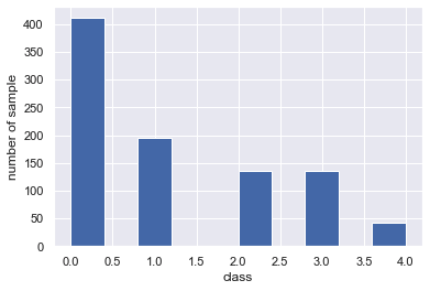
There are many 0 classes of healthy people, and the number of severely ill patients is decreasing. There are so many such imbalance problems in real life.
You need to split the data without changing this percentage.
from sklearn.model_selection import StratifiedShuffleSplit

#Separate objective variable
X = merge_data.drop("class",axis=1).values
y = merge_data["class"].values
columns_name = merge_data.drop("class",axis=1).columns

#Define a function to classify
sss = StratifiedShuffleSplit(n_splits=1, test_size=0.2, random_state=0)
def data_split(X,y):
    for train_index, test_index in sss.split(X, y):
        X_train, X_test = X[train_index], X[test_index]
        y_train, y_test = y[train_index], y[test_index]

    X_train = pd.DataFrame(X_train, columns=columns_name)
    X_test = pd.DataFrame(X_test, columns=columns_name)

    return X_train, y_train, X_test, y_test

# train, test,Separated into val
X_train, y_train, X_test, y_test = data_split(X, y)
X_train, y_train, X_val, y_val = data_split(X_train.values, y_train)

#shape confirmation
print("train shape", X_train.shape)
print("test shape", X_test.shape)
print("validation shape", X_val.shape)

#Check class percentage
plt.figure(figsize=(20,5))
plt.subplot(1,3,1)
plt.hist(y_train)

plt.subplot(1,3,2)
plt.hist(y_test)

plt.subplot(1,3,3)
plt.hist(y_val)

# output
'''
train shape (588, 14)
test shape (184, 14)
validation shape (148, 14)
'''
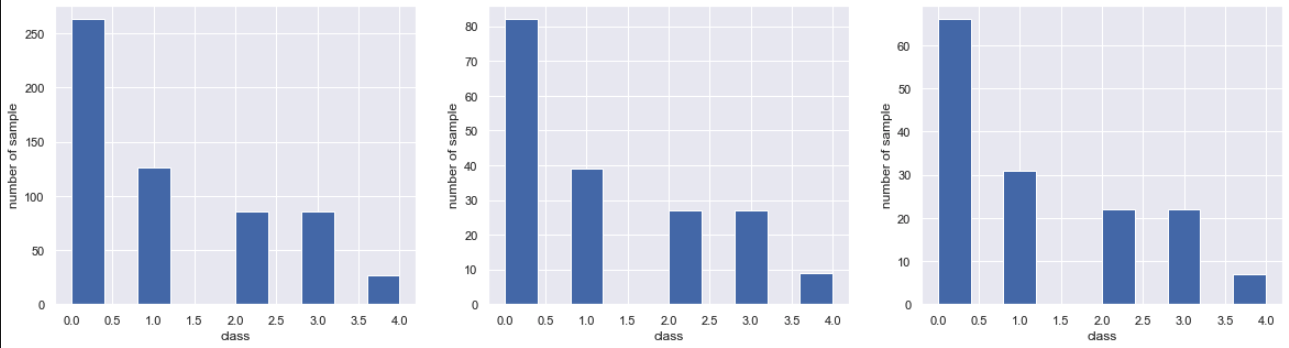 It can be divided without changing the ratio.
2. Machine learning
2.1 Dataset creation and model definition
Create a dataset and give it parameters.
import lightgbm as lgb

#Create dataset
train = lgb.Dataset(X_train, label=y_train)
valid = lgb.Dataset(X_val, label=y_val)

#Set model parameters
params = {
    'reg_lambda' : 0.2,
    'objective': 'multiclass',
    'metric': 'multi_logloss',
    'num_class': 5,
    'reg_alpha': 0.1,
    'min_data_leaf': 100,
    'learning_rate': 0.025,
#     'feature_fraction': 0.8,
#     'bagging_fraction': 0.8
}
2.2 Model training and evaluation
When training a model, specify early stopping and stop learning when the loss does not decrease. The prediction is maximum likelihood with argmax. The evaluation is based on the mixing matrix and the kappa coefficient. Only hold-out validation is performed without cross-validation.
#Train the model
model = lgb.train(params,
                  train,
                  valid_sets=valid,
                  num_boost_round=5000,
                  early_stopping_rounds=500)

#Forecast
y_pred = model.predict(X_test, num_iteration=model.best_iteration)
y_pred = np.argmax(y_pred, axis=1)

#--------------------------Model evaluation-----------------------------------------------
from sklearn.metrics import confusion_matrix
from sklearn.metrics import cohen_kappa_score

#Create a mixed matrix
result_matrix = pd.DataFrame(confusion_matrix(y_test,y_pred))
#Calculate the correct answer rate for each class
class_accuracy = [(result_matrix[i][i]/result_matrix[i].sum())*1 for i in range(len(result_matrix))]
result_matrix[5] = class_accuracy
#Calculate kappa coefficient
kappa = cohen_kappa_score(y_test,y_pred)
print("kappa score:",kappa)

# plot
plt.figure(figsize=(7,5))
sns.heatmap(result_matrix,annot=True,cmap="Blues",cbar=False)
plt.xticks([5.5,4.5,3.5,2.5,1.5,0.5], ["accuracy",4, 3, 2, 1,0])
plt.ylabel('Truth',fontsize=13)
plt.xlabel('Prediction',fontsize=13)
plt.tick_params(labelsize = 13)

# output
'''
kappa score: 0.3368649587494572
'''
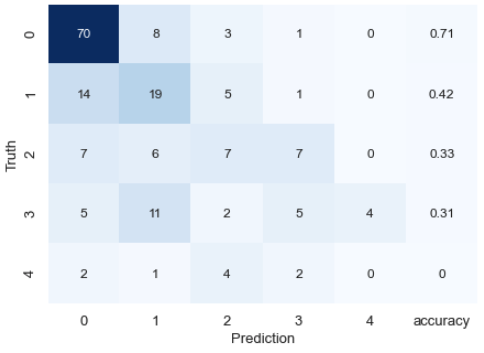
The results are not very good, but aside from that, we confirm the importance of the features.
2-3. Confirm the importance of features
lgb.plot_importance(model, figsize=(8, 6))
plt.show()
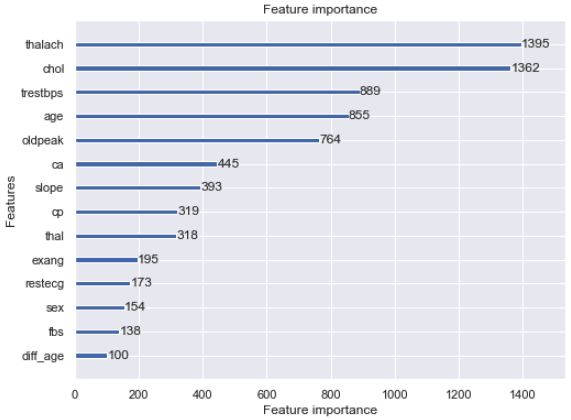
The result was that the feature amount created was the lowest.
in conclusion
This time, we performed from data preprocessing to model evaluation by holdout. Feature engineering and high-parameter search are required to improve accuracy. In addition, cross-validation evaluation is required to ensure accuracy.
Recommended Posts