[Python] Determine the type of iris with SVM
Let's try a machine learning classification problem using iris data, which is often used in beginner lectures.
Data to use
irei data. (Iris means "iris" flower.) Data on three iris varieties, Setosa Versicolor Virginica. A total of 150 datasets.
Data set contents
Sepal Length: The length of the sepal
Sepal Width: Width of sepal
Petal Length: Petal Length
Petal Width: Width of petals
Name: Iris-Setosa, Iris-Vesicolor, and Iris-Virginica variety data

Model to adopt
SVM (Support Vector Machine). SVMs are suitable for supervised learning classification problems. A model that can also make spam discriminators. Since it is supervised learning, feature data and objective variables are required.
Overall flow
- Data preparation
- Visualize the data
- Learning and evaluating the model
Practice
1) Data preparation
First, after importing the required library, import the data and check.
import numpy  as np
import pandas as pd
import seaborn as sns
sns.set_style("whitegrid")
import matplotlib.pyplot as plt
%matplotlib inline
from sklearn.model_selection import train_test_split, cross_validate

df = pd.read_csv("iris.csv")
df.head()

	SepalLength	SepalWidth	PetalLength	PetalWidth	Name
0	5.1	3.5	1.4	0.2	Iris-setosa
1	4.9	3.0	1.4	0.2	Iris-setosa
2	4.7	3.2	1.3	0.2	Iris-setosa
3	4.6	3.1	1.5	0.2	Iris-setosa
4	5.0	3.6	1.4	0.2	Iris-setosa
Divide into training data and test data.
X = df[["SepalLength","SepalWidth","PetalLength","PetalWidth"]]
y = df["Name"]

X_train, X_test, y_train, y_test = train_test_split(X, y)
X_train.shape, X_test.shape

((112, 4), (38, 4)) #Check the number of matrices after division
Create a Dataframe for each of the training data and test data.
data_train = pd.DataFrame(X_train)
data_train["Name"] = y_train
2) Visualize the data
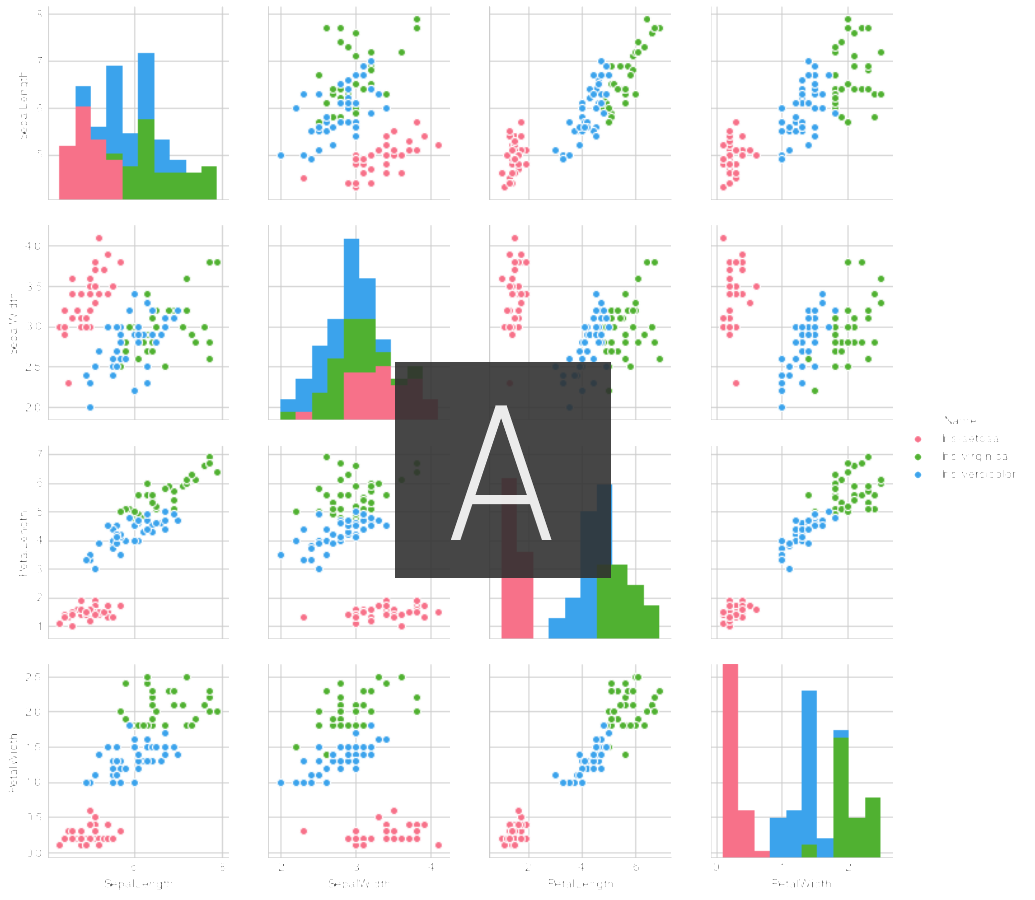
In the verification data, what is the actual relationship between the type of iris and the amount of excess acquired? Plot and see if there are differences in features for each type.
sns.pairplot(data_train, hue='Name', palette="husl")

Certainly, it seems that there is a clear difference in each feature amount depending on the type of iris.
3) Learning and evaluating the model
Let's actually put the verification data in the SVM and create a model.
X_train = data_train[["SepalLength", "SepalWidth","PetalLength"]].values
y_train = data_train["Name"].values

from sklearn import svm,metrics

clf = svm.SVC()
clf.fit(X_train,y_train)
Enter test data into the created model.
pre = clf.predict(X_test)
Evaluate the model.
ac_score = metrics.accuracy_score(y_test,pre)
print("Correct answer rate=", ac_score)

Correct answer rate= 0.9736842105263158
It was confirmed that the test data and the results obtained by the model were 97% consistent.
Recommended Posts