Load the network modeled with Rhinoceros in Python ①
Network analysis is one of the most popular mathematics of architecture and city planning. It is a common practice to analyze and simulate architecture and cities in a mathematically easy-to-use form by abstractly expressing them as networks.
Goal
- Draw a network with Rhinoceros
- Export the network drawn in Rhinoceros so that it can be read in Python
- Read the exported file with Python and create an adjacent array
This article addresses Section 1.
Network in architecture / city
Various networks are woven into architecture and cities.
| Target | node | Edge |
|---|---|---|
| Architectural plane | room,Aperture | Corridor,aisle |
| road | intersection,Building entrance | road |
| Railroad | station | line |
A network consists of nodes and edges, and the edges (and sometimes nodes) are given "weights". The weight can set the distance traveled, time (time distance), cost (monetary distance), etc. required to pass through the edge. With just one method of weighting, the breadth and fun of the analysis will increase dramatically.
Draw a network with Rhinoceros
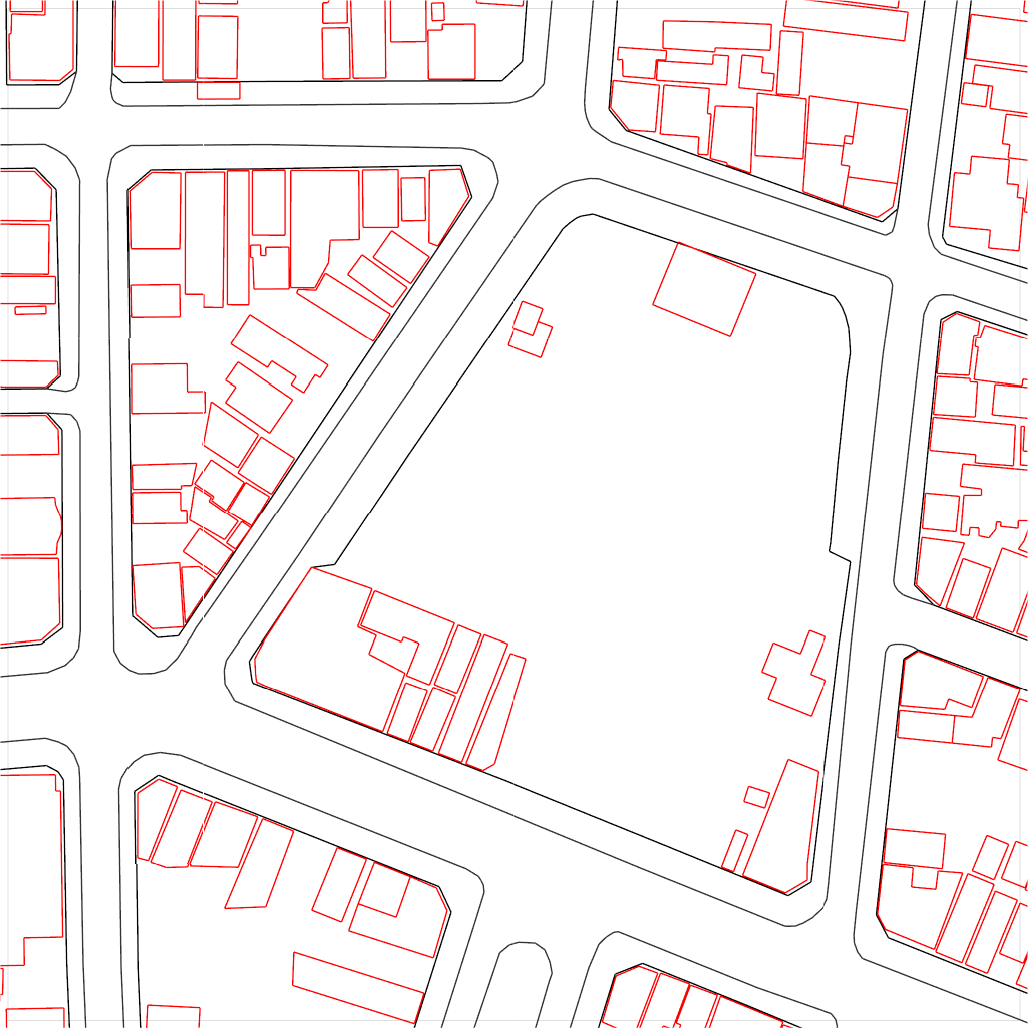
Anyway, let's draw a network. This time, I will draw a network using CAD software called Rhinoceros. Some people in the architectural community may be bright in Rhinoceros. Rhinoceros can run Python in it, so it is very convenient for mathematical research on architecture and city planning. This time, I will draw a pedestrian space network based on the map below (Geographical Survey Institute map).
[](

Unify the rules for drawing networks
If you have public vector data such as the road center line, you can use it, but if you do not have it, you will have to draw the line yourself. At that time, it is important to ** follow the rules you have decided **. Perhaps when you network yourself, you'll have to worry about "what to do with curved roads" and "how to connect buildings to the network." In fact, the results of network analysis can be greatly influenced by how the network is drawn. The important thing is to be able to determine whether the result is a network drawing or an essential one. To that end, it is necessary to unify the rules once decided throughout the network.
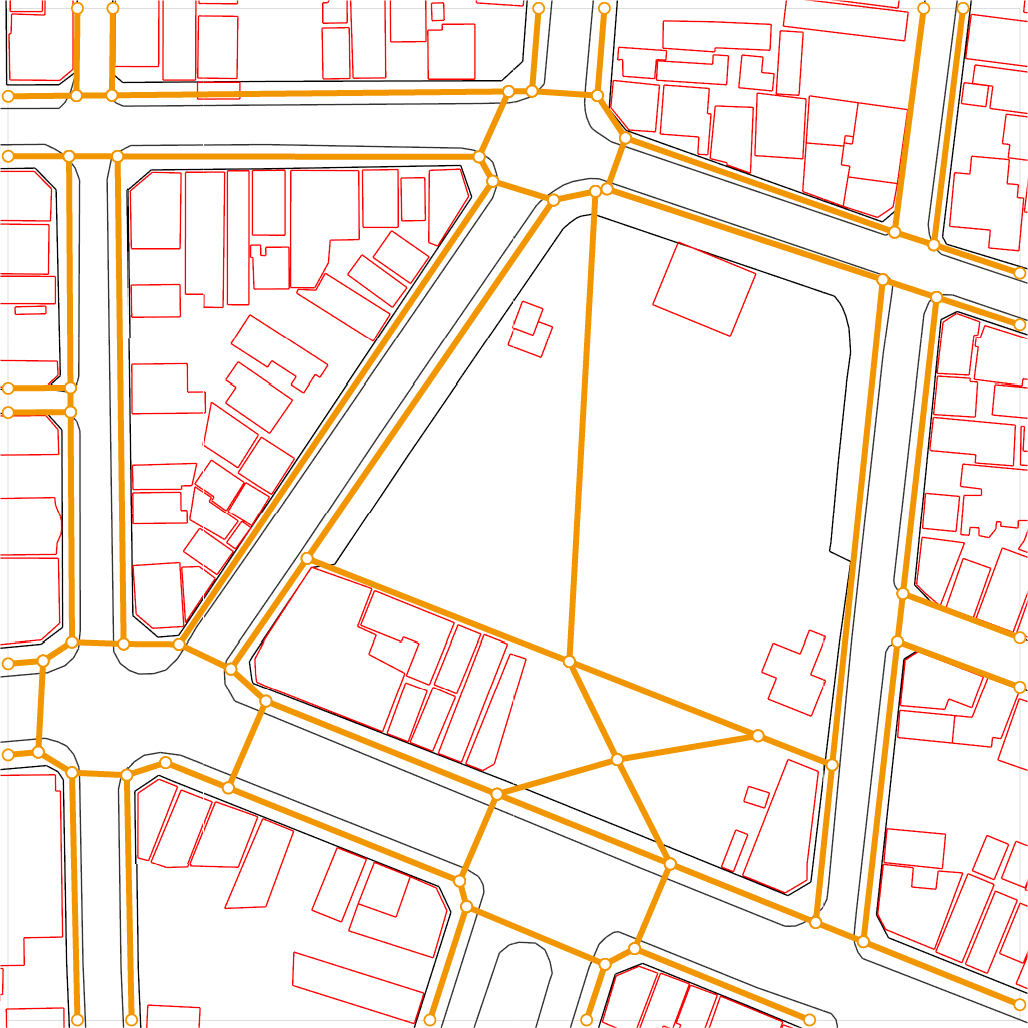
This time, I will draw a pedestrian space network, but I will follow the maintenance specification proposal [^ 1] presented by the Ministry of Land, Infrastructure, Transport and Tourism. Then, the network will be as shown in the figure below.
 This time, the network is on a plane, so there are no self-intersecting edges. If you have a pedestrian bridge or an underpass, you can model it to include them for more detailed analysis.
[Next time] Export the network drawn by Rhinoceros so that it can be read by
Python.
Now that you've finished drawing your network in Rhinoceros, you'll need to translate it into data that your programming language can understand before you analyze it. Next time, I will explain the data structure and how to create the data. → Read the network modeled by Rhinoceros in Python②
Homepage information
The contents of my research on architecture and urban planning mathematics and tips related to the research are available on my personal website. Eventually, I would like to create an analysis tool that can be used easily, so please come and take a look. → Shota Tabata's personal homepage
References
Recommended Posts