python beginners tried to predict the number of criminals
** Introduction **
First of all, let me briefly introduce myself. I studied engineering (chemistry) at university and have been working as a researcher at a general company for the fifth year. I received half a year of childcare leave from the company this time, so I decided to study programming during the childcare period. It was my motivation to get started, but I saw many videos on YouTube such as "Recently, you can easily learn programming". Coupled with the fact that I had touched it a little when I was in college, I decided to take the plunge and go to online school for three months.
** Overview of this article **
-** What kind of person is the article for **
Completely for beginners. I want people who want to start programming now to read it.
I write from how I chose an online school and what I learned.
-** Challenged in this article **
Among the techniques I learned during the three-month course, I decided on my own subject and moved the code that I found interesting.
Specifically, I tried to predict the number of criminals by month.
At first, I tried to predict with the LSTM model, but the accuracy was not good, so I tried to predict using machine learning.
** Review of online learning **
-** Why did you choose Aidemy **
There were many options when choosing an online school.
I went to see each website, but decided on Aidemy, which had the fewest advertisements from the business, such as the success rate of changing jobs.
Rather than hone your skills for changing jobs this time, what is purely trendy opportunity learning and deficiency planning?
As a result, this choice was good.
Also, it was great that the representative appeared on the Horiemon channel and that Mr. Takumi of Yobinori recommended it.
-** What I learned at Aidemy **
I was in a data analysis course
Since I chose the Premium Plan, I was able to learn the teaching materials of other courses with + α.
I was able to study extensively and was very satisfied. Let me briefly describe what I learned.
(1) Numpy, Pandas, Matplotlib, data cleansing, data handling
(2) Supervised learning, unsupervised learning
(3) Time series analysis, stock price forecast, kaggle competition (Titanic, house price forecast)
(4) Natural language processing, topic extraction, sentiment analysis
(5) Deep learning image recognition
** [Main subject] Prediction of the number of criminals **
** ● Number of criminals ** Now the main subject. This time I decided to predict the number of criminals by month. First, make a prediction using the LSTM model. The data used was pulled from a page that manages government statistics called e-Stat. We will deal with the number of "Persons handling alleged cases by offense (January 2007-January 2018)".
- The term "number of crimes recognized" may be more common, I chose this statistic because I wanted to count crimes by number of people, not by number of cases.
** ● Reading data and removing indexes and columns ** The data used is the first column of the first Sheet. In addition, the value of the extracted data is converted to a float type and read in order to be suitable for analysis by LSTM.
#Data reading
dataframe = pd.read_excel('./blog_data/criminal_prediction.xlsx', sheet_name=0, usecols=[0])

#index,columns removal
dataset = dataframe.values

#Convert to float type
dataset = dataset.astype('float32')
** ● Creation of training data and test data ** Divide the first two-thirds for training and the remaining one-third for testing. There are 89 train data and 44 test data.
#Calculate the number of data to be used as training data
train_size = int(len(dataset) * 0.67)

#Divided into training data and test data
train, test = dataset[0:train_size, :], dataset[train_size:len(dataset), :]

print(len(dataset), len(train), len(test))
#Output result: 133 89 44
** ● Data scaling ** Scaling is performed in preprocessing. Here, normalization (MinMaxScaler) was used to perform scaling based on the training data.
from sklearn.preprocessing import MinMaxScaler

#Minimum value is 0,Define the scaling method so that the maximum value is 1.
scaler = MinMaxScaler(feature_range=(0, 1))

# `train`Define parameters to scale relative to
scaler_train = scaler.fit(train)

#With parameters`train`Scaling data
train = scaler_train.transform(train)

#With parameters`test`Scaling data
test = scaler_train.transform(test)
** ● Creation of input data and correct label ** In LSTM prediction, the data at the next time point is predicted using the data several times before the reference time point. Here, the input data and the correct label were created with the following requirements.
・ Input data: Data up to 3 months ago, including the reference point ・ Correct label: Data at the time after the reference point
import numpy as np

#Define a function to create input data / correct label
# data_X: Input data. One set of data for n months
# data_Y: Correct label. The next month after X is the correct answer
def create_dataset(dataset, look_back):
    data_X, data_Y = [], []
    for i in range(look_back, len(dataset)):
        data_X.append(dataset[i-look_back:i, 0])
        data_Y.append(dataset[i, 0])
    return np.array(data_X), np.array(data_Y)

#Create input data and correct label with the previous data as one set
look_back = 3

#Created function`create_dataset`Create input data / correct label using
train_X, train_Y = create_dataset(train, look_back)
test_X, test_Y = create_dataset(test, look_back)
** ● Data shaping ** Since the created data is not in a data format that can be analyzed by LSTM, format the input data. Converts the input data into a three-dimensional matrix of the number of rows x the number of variables x the number of columns, and formats it into a data format that can be analyzed by LSTM.
-Number of lines: Total number of data -Number of variables: Number of elements included in one set of data = look_back -Number of columns: Number of types of data to be handled = 1 (only one type of number of criminals)
#Data formatting
#3D numpy.Convert to ndarray
train_X = train_X.reshape(train_X.shape[0], train_X.shape[1], 1)
test_X = test_X.reshape(test_X.shape[0], test_X.shape[1], 1)
** ● Construction and training of LSTM network ** Next, we will build an LSTM network and train the model using the prepared data.
from sklearn.metrics import mean_squared_error
import keras
from keras.models import Sequential
from keras.layers.core import Dense, Activation
from keras.layers.recurrent import LSTM
from keras.callbacks import EarlyStopping

#Create LSTM model
model = Sequential()
model.add(LSTM(64, input_shape=(look_back, 1), return_sequences=True))
model.add(LSTM(32))
model.add(Dense(1))

#Compile the model
model.compile(loss='mean_squared_error', optimizer='adam')

#Training
model.fit(train_X, train_Y, epochs=50, batch_size=1, verbose=1)
** ● Data prediction / evaluation ** Now that the model has been built and trained, it is time to predict and evaluate the data. In order to correctly evaluate the prediction result of the output data, it is necessary to restore the scaled data. To restore it, use the inverse_transform () method, which performs the inverse transformation of the transform () method. The error is large probably because there is little data.
import math

#Create forecast data
train_predict = model.predict(train_X)
test_predict = model.predict(test_X)

#Undo scaled data
train_predict = scaler_train.inverse_transform(train_predict)
train_Y = scaler_train.inverse_transform([train_Y])
test_predict = scaler_train.inverse_transform(test_predict)
test_Y = scaler_train.inverse_transform([test_Y])

#Calculation of prediction accuracy
train_score = math.sqrt(mean_squared_error(train_Y[0], train_predict[:, 0]))
print('Train Score: %.2f RMSE' % (train_score))
#Output result: Train Score: 13596.52 RMSE

test_score = math.sqrt(mean_squared_error(test_Y[0], test_predict[:, 0]))
print('Test  Score: %.2f RMSE' % (test_score))
#Output result: Test Score: 14855.30 RMSE
** ● Visualization of forecast results ** Plot the following three in one graph. -Data as read (dataset) ・ Value predicted from training data (train_predict) -Value predicted from test data (test_predict)
import matplotlib.pyplot as plt
#Data shaping for plots
train_predict_plot = np.empty_like(dataset)
train_predict_plot[:, :] = np.nan
train_predict_plot[look_back:len(train_predict)+look_back, :] = train_predict
test_predict_plot = np.empty_like(dataset)
test_predict_plot[:, :] = np.nan
test_predict_plot[len(train_predict)+(look_back*2):len(dataset), :] = test_predict
#Data plot
plt.title("monthly-suspected-criminals-in-ten-years")
plt.xlabel("time(month)")
plt.ylabel("Persons")
#Plot the data as it is read
plt.plot(dataset, label='dataset')
#Plot the values predicted from the training data
plt.plot(train_predict_plot, label='train_predict')
#Plot the value predicted from the test data
plt.plot(test_predict_plot, label='test_predict')
plt.legend(loc='lower left')
plt.show()
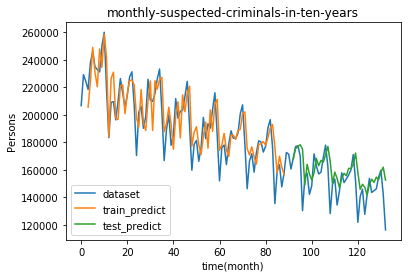 The 0 on the X-axis is January 2007. Surprisingly, the number of criminals is decreasing.
Let's expand the part of the test data.
The 0 on the X-axis is January 2007. Surprisingly, the number of criminals is decreasing.
Let's expand the part of the test data.
import matplotlib.pyplot as plt
import numpy as np
#Data shaping for plots
train_predict_plot = np.empty_like(dataset)
train_predict_plot[:, :] = np.nan
train_predict_plot[look_back:len(train_predict)+look_back, :] = train_predict
test_predict_plot = np.empty_like(dataset)
test_predict_plot[:, :] = np.nan
test_predict_plot[len(train_predict)+(look_back*2):len(dataset), :] = test_predict
#Data plot
plt.title("monthly-suspected-criminals-in-ten-years")
plt.xlabel("time(month)")
plt.ylabel("Persons")
#Range setting
plt.xlim(89,140)
plt.ylim(110000,200000)
#Plot the data as it is read
plt.plot(dataset, label='dataset')
#Plot the values predicted from the training data
plt.plot(train_predict_plot, label='train_predict')
#Plot the value predicted from the test data
plt.plot(test_predict_plot, label='test_predict')
plt.legend(loc='upper right')
plt.show()
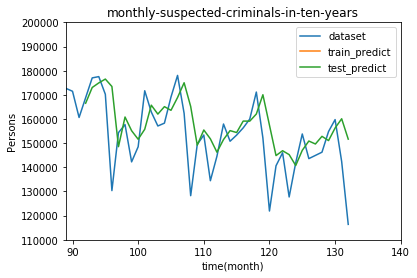
Well, probably because there is little data, errors are noticeable in some places.
** I tried to predict by machine learning **
I felt a little incomplete combustion, so I changed my perspective and tried a little more.
I thought that it would be possible to predict the number of criminals with an explanatory variable that is completely different from the number of criminals, so I prepared the following data.
 Using these, we performed multiple regression analysis as follows.
import pandas as pd
from sklearn.model_selection import train_test_split
from sklearn.linear_model import LinearRegression

#Read data, delete date
df = pd.read_excel('./blog_data/criminal_prediction.xlsx', sheet_name=0)
df = df.drop(df.columns[0], axis=1)

X = df.drop('Personnel receiving alleged cases', axis=1)
y = df['Personnel receiving alleged cases']

#Data split
X_train, X_test, y_train, y_test = train_test_split(X, y, test_size=0.2, random_state=42)

#Training, evaluation
model =  LinearRegression()
model.fit(X_train, y_train)
R2 = model.score(X_test, y_test)

print("{:.5f}".format(R2))
#Output result: 0.79810
It's a decent result. I am satisfied for the time being.
in conclusion
The course period has ended, but I will continue to find time to study little by little. It was good to be able to touch a wide range while actually executing the code by the time I graduated.
Recommended Posts