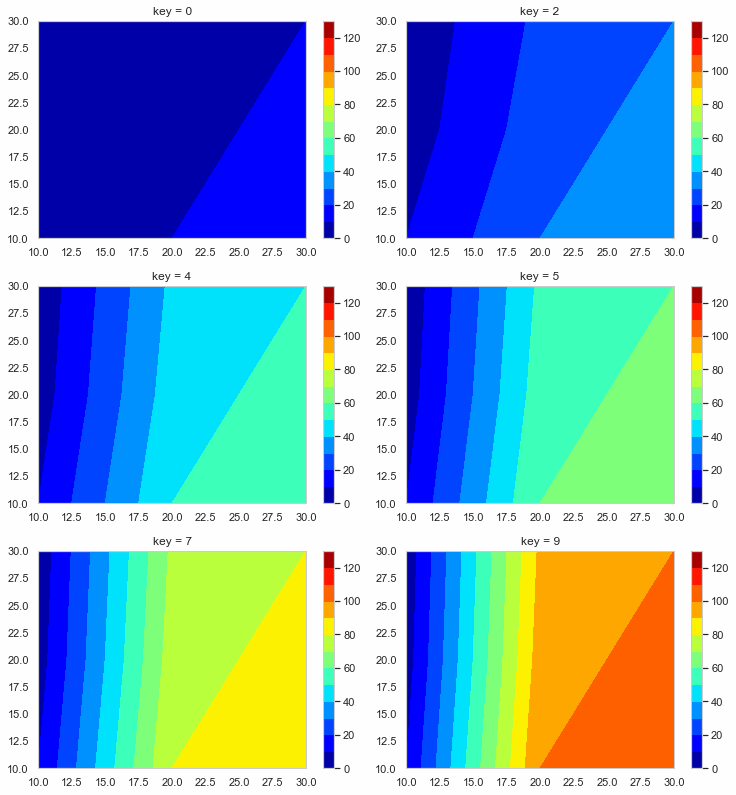
Create a GIF file using Pillow in Python
I made a GIF video that made the contour figure look like a flip book, so I made a memorandum. The environment is Python 3.6.8
matplotlib.animation
It seems that you can make a graph that works with matplotlib.animation.
It seems normal to use imagemagick as a writer to save it as a GIF file.
imagemagick
It seems a little troublesome when installing on windows.
The page that I used as a reference when trying to install. https://higuma.github.io/2016/08/31/imagemagick-1/
Python library Pillow
The site that I referred to about Pillow.
Installation https://note.nkmk.me/python-pillow-basic/
How to make a GIF https://note.nkmk.me/python-pillow-gif/
Try to make
import_lib.py
import pandas as pd
import numpy as np
import matplotlib.pyplot as plt
import os
from PIL import Image, ImageDraw
Prepare data like this.

Coordinates assume something like this

test_data.py
test_data = pd.DataFrame({'key':range(10),
                          't1': [10] * 10,
                          't2': [i * 10 + 10 for i in range(10)],
                          't3': [i * 10 + 20 for i in range(10)],
                          't4': [5] * 10,
                          't5': [i * 10 + 5 for i in range(10)],
                          't6': [i * 10 + 15 for i in range(10)],
                          't7': [3] * 10,
                          't8': [i * 10 + 2 for i in range(10)],
                          't9': [i * 10 + 10 for i in range(10)]})

t = ['t' + str(int(i)) for i in range(1, 10)]
x = [i * 10 for i in range(1, 4)] * 3
y = [10] * 3 + [20] * 3 + [30] * 3
Create a data extraction function to create a contour diagram
create_function.py
def f_contour_data(df, timing):
    #Extract the data of the row at the timing you want to draw the contour diagram
    df0 = df[df['key'] == timing].copy()
    #Set index to 0 so that the extracted data can be used easily.
    df0.reset_index(drop = True, inplace = True)

    x = [10, 20, 30] #X-axis of contour diagram
    y = [10, 20, 30] #Y-axis of contour diagram

    #Make a list of numbers
    # [[t1, t2, t3], [t4, t5, t6], [t7, t8, t9]]
    #Make this
    l_T = []
    for i in range(len(y)):
        T = ['t' + str(int(j + i * 3)) for j in range(1, 4)]
        l_T.append(T)

    #Create an x-axis 2d array
    x0 = np.empty((0, len(y))) #Create an empty ndarray
    for i in range(len(y)):
        x0 = np.append(x0, np.array([x]), axis = 0) #Replace x with ndarray and add to x0
    #Create a y-axis 2d array
    y0 = np.empty((0, len(y)))
    for i in range(len(y)):
        y0 = np.append(y0, np.array([[y[i]] * 3]), axis = 0)

    #Create a z-axis 2d array
    z0 = np.empty((0, len(y)))
    for i in range(len(y)):
        temp = []
        T = l_T[i]
        for s in T:
            temp.append(df0[s][0])
        z0 = np.append(z0, np.array([temp]), axis = 0)
    return x0, y0, z0, l_T # l_T is for confirmation and can be deleted
If you use this to draw a contour diagram on a texto, it will look like this.
create_contour.py
x0, y0, z0, l_t = f_contour_data(df = test_data, timing = 0)

plt.figure()
p = plt.contourf(x0, y0, z0, cmap = 'jet')
cbar = plt.colorbar(p)

After that, I will make more and more this in a loop and save it.
loop.py
l_img = [] #Of the contour diagram.List to put png path
os.makedirs('Contour_gif/', exist_ok = True) #Create a folder for saving graphs
lv = [i * 10 for i in range(14)]
for i in range(10):
x0, y0, z0, l_tc = f_contour_data(df = test_data, timing = i)
plt.figure()
p = plt.contourf(x0, y0, z0, lv, 
cmap = 'jet')
cbar = plt.colorbar(p)
plt.title('key = ' + str(int(i)))
save_path = 'Contour_gif/key_' + str(int(i)) + '.png'
plt.savefig(save_path, bbox_inches="tight") #Save the created graph
l_img.append(save_path) #I want to keep the order of the contour diagram surely, so add it to the list here
images = [] #Put the opened png in it.
#Separately l_You don't have to specify the range of img. I get angry depending on the size of the image. .. ..
for s in l_img[0:151]:
im = Image.open(s)
images.append(im)
# images[0]The time to switch with duration that connects the rest from the starting point(msec) loop =Infinite loop at 0
images[0].save('test.gif',
save_all = True, append_images = images[1: len(images)],
duration = 500, loop = 0, optimaize = False)
You can create a GIF file like this.

Recommended Posts