Draw a weakness graph in Python and save it in various formats (Raspberry Pi, macOS)
Deliverables
Draw a weakness graph with Japanese and save it in various formats.
--Image (PNG, JPEG, TIFF, SVG, PDF) --GIF animation, MPEG4 video --Real-time drawing
If you want to try it right away, pass the commentary
 This is an animated GIF output at 50% scale.
What I did (Raspberry Pi, macOS)
- Draw a handwritten graph using matplotlib, Python's graph drawing library.
- Make Japanese fonts available and make them handwritten.
- Write the formula in LaTeX notation. (Japanese fonts cannot be used.)
- Draw in real time like an animation.
- Save the final result as an image (PNG, JPEG, TIFF, SVG, PDF).
- Save the progress as an MPEG4 video.
- Save the progress as a GIF animation.
Environment (2021-01-14)
Raspberry Pi: Raspberry Pi 3B, Raspbian Stretch, Python 3.5.3 Raspberry Pi 4B, Raspbian Buster, Python 3.7.3 macOS:Macbook Air 13inch 2017、Mojave、Python 3.7.9
matplotlib 3.0.3 to 3.3.3, numpy 1.17.0 to 1.18.2 ffmpeg 1.4
It's been running the same code for quite some time, so the environment is less version-dependent. Perhaps it will work fairly well in a Windows environment.
Handwritten graph? What is it?
What is xkcd? ?? This is a science or otaku web comic. (→ wikipedia) It looks theoretical and scientific, but it has a black joke flavor. The author is Randall Munroe
The xkcd-like graph is a weak system and looks like this (→ Image Search)
So, this xkcd-like graph drawing function is officially built into the graph drawing library matplotlib. → Quite motivated and weak matplotlib official gallery (I'm just replacing the PNG image with the URL with/xkcd/added.)
If you put this weakness graph in a presentation / class slide, it will give you a nice taste, and if you draw it with animation, you can get more attention.
Explanation of how to draw a weakness system
Pass for those who want to try it immediately
It's very easy if you just want to make it look like xkcd. Just add `plt.xkcd ()`. It adjusts various parameters in the weakening direction.
from matplotlib import pyplot as plt

plt.xkcd()
#After that, weakness system
If you want to make it partially xkcd-like, use `` `with``` blocking.
#Outside the block, it's a serious graph.
with plt.xkcd():
    #If you draw in this block, it is a weakness system.
    #
#Outside the block, it's a serious graph.
Animation in real time
If you want to see what you are drawing in real time, draw in interactive mode with `plt.ion ()`.
plt.ion()     #Start interactive mode
#
#Draw a graph
#
plt.ioff()    #End interactive mode
plt.show()    #Leave the window even after you finish drawing.
Save in various formats
Press the button to save the image
The window that pops up when you draw the graph has a save button (an icon that doesn't fit the youth of today). Press this to save as PNG.

Save various formats programmatically
I was able to save as PNG, JPEG, TIFF, SVG, PDF without any problem.
In the case of macOS, the backend cannot be saved with the default MacOSX, and it becomes a pure white image. I had to choose Agg, a backend without GUI. unsolved. For Raspberry Pi, the default backend PyQt5 is okay. You can save images while displaying the screen.
#You can save multiple types.
    plt.savefig("heart.png ")
    plt.savefig("heart.jpeg ")
    plt.savefig("heart.tiff")
    plt.savefig("heart.svg")
    plt.savefig("heart.pdf")

# PS,In EPS, the axis etc. has become a straight line.
    plt.savefig("heart.ps")
    plt.savefig("heart.eps")
#If you specify a backend, specify it before importing pyplot.
import matplotlib
matplotlib.use('Agg')
from matplotlib import pyplot as plt
#Check the specified backend
print("current backend:", plt.get_backend())
Save as MPEG4 video or GIF animation
The two are similar, switching between writer.
mp4 version
FFMpegWriter = manimation.writers['ffmpeg']
metadata = dict(title='Heart Curve', artist='Matplotlib',
        comment='Movie support!')
writer = FFMpegWriter(fps=15, metadata=metadata)


with writer.saving(fig, "heart_curve.mp4", 100):
    writer.grab_frame()
GIF animated version
import matplotlib.animation as manimation
from matplotlib.animation import PillowWriter

PillowWriter = manimation.writers['pillow']
fig.set_dpi(50)  #How it works depends on the back end


with writer.saving(fig, "heart_curve.gif", dpi=None):
    writer.grab_frame()
Show what you are drawing in real time
Every time you draw something, you can pause it as `plt.pause (0.5)`.
Font related
When you install fonts, you need to rebuild the matplotlib font cache.
import matplotlib.font_manager as fm
fm._rebuild()
Code that extracts only the font name and displays it in a list
You will need it when you specify the font family name like this,
plt.rcParams["font.family"] = "Natsume"
import matplotlib.font_manager as fm
font_names=[] for font_path in fm.findSystemFonts(): try: font_name = fm.FontProperties(fname=font_path).get_name() except Exception as e: print(font_path) print("ERROR::: can't get the font name from the file above. ", e) print("********") finally: font_names.append(font_name)
font_names2 = list(set(font_names))
font_names2.sort()
for font_name in font_names2: print(font_name)
### Reference: Handwritten font information

 Original xkcd font [xkcd] [xkcd Script]
https://github.com/ipython/xkcd-font
 It seems that it was sampled from the handwritten characters of the author of the comic. Of course, only the alphabet.


 Japanese handwritten font [keyword specified by font.family]

 851 MkPOP [851MkPOP]
 851 Handwritten miscellaneous font [851tegakizatsu]
 Natsume Moji / Natsume Moji Suppression [Natsume] [Natsumemozi-o]
 Apricot Moji / Apricot Moji Monospaced [APJapanesefont] [APJapanesefontT]
 Apricot moji performance / Apricot moji 湛 [APJapanesefontK] [APJapanesefontT]
 Apricot Moji Beginning / Apricot Moji Beginning Monospaced [APJapanesefontH] [APJapanesefontHT]
 Ranobe POP [07LightNovelPOP]
 Gagagaga FREE version (katakana) [GAGAGAGA]

### path!
 Aside from the long story.
# Install the font and try it out

 If you don't have handwritten fonts, install "Natsume Moji" for the time being. If you comment out the font specification line, you can try it only with weak lines, but it is less than half the attractiveness, so please install it. Please read the above [Font related](#フォント関係).

 We recommend Kyoko's "Natsume Moji".
http://www8.plala.or.jp/p_dolce/

 If you want to use your favorite font, use [Code to extract and list only font names](#フォント名だけ抜き出してリスト表示するコード) to find out the font names.
For Raspberry Pi, after installing Rebuild the system font cache. fc-cache -v
Python font cache rebuild import matplotlib.font_manager as fm fm._rebuild()
# Deliverables and codes
The code can run ipython3 in the terminal and copy and paste all lines in one shot.
In addition, all are iPython, but REPL such as mu-editor, Jupyter Notebook, etc. is also okay. I wonder if VS Code's Jupyter is crazy. However, note that VS Code's Jupyter environment seems to be slow in real time.
Of course, you can save it as a .py file and run it.
# Weakness graph
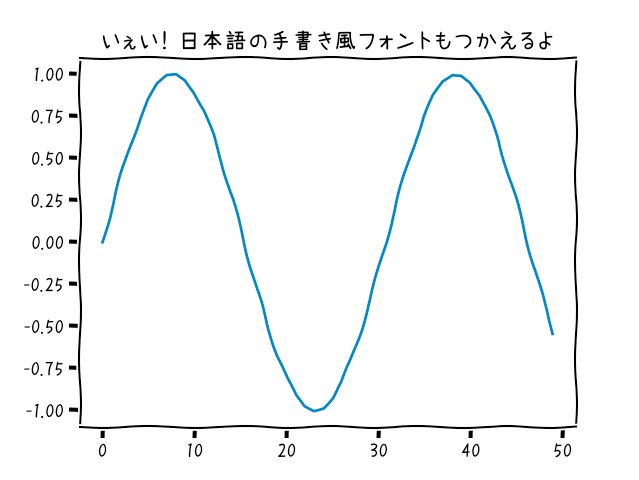
from matplotlib import pyplot as plt import numpy as np
plt.xkcd()
#plt.rcParams["font.family"] = "Gen Shin Gothic P" plt.rcParams["font.family"] = "Natsume" #plt.rcParams["font.family"] = "GenEi LateGo"
plt.plot(np.sin(np.linspace(0, 10))) plt.title('Yeah! You can also use Japanese handwritten fonts') plt.show()
# Weakness pie chart
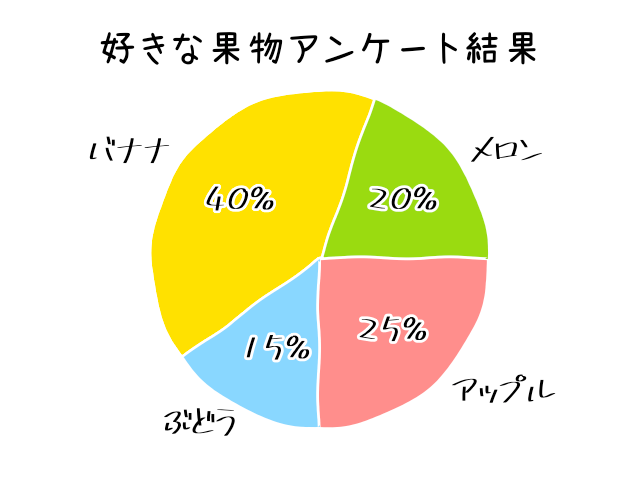
from matplotlib import pyplot as plt import numpy as np
plt.xkcd() plt.rcParams["font.family"] = "Natsume"
x = np.array([0.2, 0.4, 0.15, 0.25])
#plt.rcParams["font.family"] = "Natsume" plt.rcParams["font.family"] = "851MkPOP" plt.rcParams["font.size"] = 24
labels = ['melon', 'banana', 'Grape', 'Apple'] colors = ['yellowgreen', 'gold', 'darkviolet', 'hotpink'] plt.pie(x, autopct='%d%%', labels=labels, colors=colors) plt.axis('equal') plt.title('Favorite fruit questionnaire results', fontname="Natsume") plt.tight_layout()
plt.show()
# Weakness function
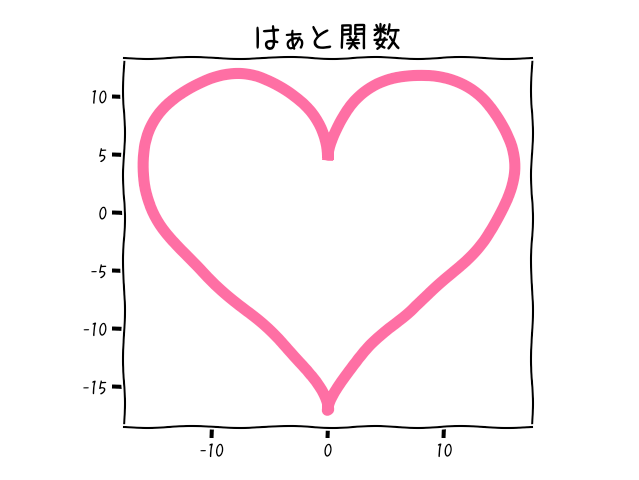
from matplotlib import pyplot as plt from numpy import arange, pi, sin, cos
plt.xkcd() plt.rcParams["font.family"] = "Natsume"
STEP = 0.1 # 0.01 to 0.Speed / accuracy adjustment with 1
def draw_graph(x, y, title, color): plt.title(title, fontsize=24) plt.gca().set_aspect('equal', adjustable='box') plt.plot(x, y, color=color, linewidth=8) plt.show()
def draw_heart(): intervals = arange(0, 2 * pi, STEP) x = [] y = [] for t in intervals: x.append(16 * sin(t) ** 3) y.append(13 * cos(t) - 5 * cos(2 * t) - 2 * cos(3 * t) - cos(4 * t)) draw_graph(x, y, title='Heart function', color='#FF6597')
draw_heart()
# Weakness function with real-time drawing version TeX demo
This is Jupyter's in-page drawing, it takes a lot of time to draw frame by frame without overwriting each frame. It depends on the machine power, but it may be better not to do it with VS Code. Let's feed iPython from the terminal.

realtime drawing version
import matplotlib
from matplotlib import pyplot as plt from numpy import arange, pi, sin, cos
plt.xkcd() plt.rcParams["font.family"] = "Natsume" plt.rcParams["font.size"] = 12 plt.rcParams['xtick.direction'] = 'in' plt.rcParams['ytick.direction'] = 'in'
plt.xticks(arange(-20, 21, 10)) plt.yticks(arange(-20, 21, 5))
plt.title('Heart function', fontsize=24) plt.gca().set_aspect('equal', adjustable='box')
STEP = 0.05 # 0.01 to 0.Speed / accuracy adjustment with 1
def draw_heart(): intervals = arange(0, 2 * pi, STEP) x = [] y = [] plt.ion()
for t in intervals:
    x.append(16 * sin(t) ** 3)
    y.append(13 * cos(t) - 5 * cos(2 * t) - 2 * cos(3 * t) - cos(4 * t))
    plt.plot(x, y, color='#FF6597', linewidth=8)
plt.draw()
plt.pause(0.00001)
draw_heart() #plt.close()
plt.text(0.0, 2.0, r"
plt.ioff() plt.show()
 reference
 Animation in Jupyter Lab
https://qiita.com/fhiyo/items/0ea94b0de6cd5c76d67a
https://github.com/matplotlib/jupyter-matplotlib
Recommended Posts