2016 The University of Tokyo Mathematics Solved with Python
Introduction
This article is the 11th day article of Python Advent Calendar 2016.
What to do here
Last year's Python Adevent Calendar dealt with Mathematics IIB of the Center Test, but this year we will deal with the University of Tokyo Mathematics (Humanities).
- The questions dealt with in this article are [Kawai Juku (general educational institution / preparatory school) / 2016 National Public University Secondary Examination / Private University Entrance Examination Answer Bulletin](http://kaisoku.kawai-juku.ac.jp/nyushi/ It is quoted from honshi / 16 / t01.html).
environment
- Python 3.5.0
- Anaconda 3-2.4.0
Basic usage of Sympy
What is Sympy?
Python algebra library Official documentation: http://www.sympy.org/en/index.html Japanese materials: http://www.turbare.net/transl/scipy-lecture-notes/packages/sympy.html
Symbols-Variable definitions
In [1]: from sympy import *
In [2]: x + 1
---------------------------------------------------------------------------
NameError                                 Traceback (most recent call last)
<ipython-input-2-4cf92658b648> in <module>()
----> 1 x + 1

NameError: name 'x' is not defined

In [3]: x = symbols('x')
In [4]: x + 1
Out[4]: x + 1
expand --expand
In [5]: expand((x + 1)**2)
Out[5]: x**2 + 2*x + 1
factor-factorization
In [6]: factor(x**4 - 3*x**2 + 1)
Out[6]: (1 + x - x**2)*(1 - x - x**2)
simplify --Simplify
In [7]: simplify((x**3 + x**2 - x - 1)/(x**2 + 2*x + 1))
Out[7]: x - 1
limit --extreme
In [8]: limit(x, x, oo)
Out[8]: oo
diff-differentiation
In [9]: diff(cos(x), x)
Out[9]: -sin(x)
In [10]: diff(x**3 + x**2 - x - 1, x)
Out[10]: 3*x**2 + 2*x - 1
integrate --integrate
In [11]: integrate(cos(x), x)
Out[11]: sin(x)
In [12]: integrate(x**3 + x**2 - x - 1, x)
Out[12]: x**4/4 + x**3/3 - x**2/2 - x
Matrix-Matrix
In [13]: Matrix([[1, 2, 3], [-2, 0, 4]])
Out[13]:
Matrix([
[ 1, 2, 3],
[-2, 0, 4]])
solve --solve an expression
In [14]: solve(x**2 - 1, x)
Out[14]: [-1, 1]
Question 1

- Variable xy is variable definition using Symbols
- Drop each coordinate PQR into a vector using Matrix
In [1]: import sympy as sy
In [2]: x, y = sy.symbols('x y')
In [3]: P = sy.Matrix([x, y])
In [4]: Q = sy.Matrix([-x, -y])
In [5]: R = sy.Matrix([1, 0])
- △ Express the condition that PQR is an acute triangle using the inner product of vectors
- ∠ If QPR is 90 ° or less, $ \ vec {PQ} $ ・ $ \ vec {PR} $> 0
- ∠ If PQR is 90 ° or less, $ \ vec {QP} $ ・ $ \ vec {QR} $> 0
- ∠ If PRQ is 90 ° or less, $ \ vec {RP} $ ・ $ \ vec {RQ} $> 0
- For those who want to know more about inner products and angles, ["When you see the inner product, you can see statistics" 5th Mathematics Study Group for Programmers Presentation Material](http://www.slideshare.net/matsukenbook/ 5-55326268) is recommended
- $ \ vec {PQ} $ ・ $ \ vec {PR} $ = PQ.norm () x PR.norm () x cos ∠QPR
normis the length of the vector
In [6]: sy.simplify((Q - P).dot(R - P) > 0)
Out[6]: 2*x*(x - 1) + 2*y**2 > 0
In [7]: sy.simplify((P - Q).dot(R - Q) > 0)
Out[7]: 2*x*(x + 1) + 2*y**2 > 0
In [8]: sy.simplify((P - R).dot(Q - R) > 0)
Out[8]: -x**2 - y**2 + 1 > 0
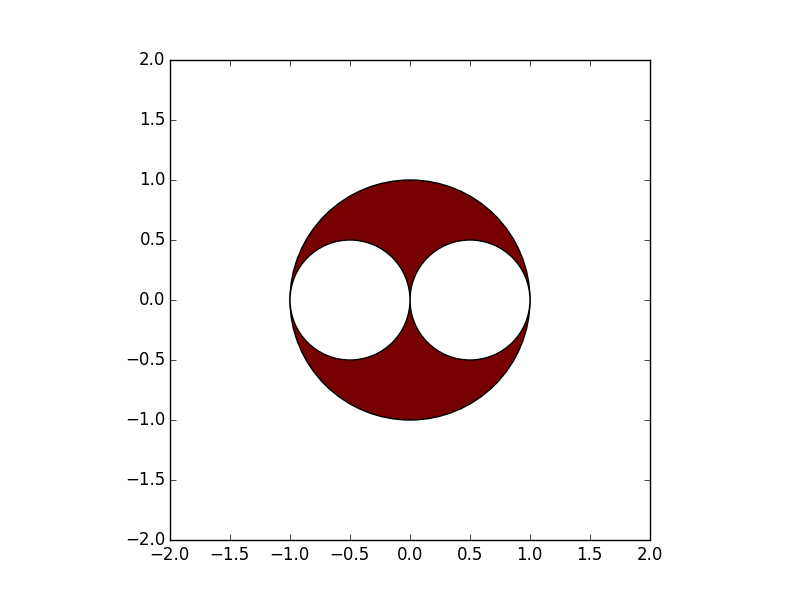
- Refactor the three equations obtained from this to make them easier to see as the condition of the circle
2x(x-1)+2y^2 > 0 <=> (x-\frac{1}{2})^2+y^2 > \frac{1}{4}
2x(x+1)+2y^2 > 0 <=> (x+\frac{1}{2})^2+y^2 > \frac{1}{4}
-x^2 - y^2 + 1 > 0 <=> x^2+y^2 < 1
- Draw a graph that meets this condition
In [9]: import matplotlib.pyplot as plt
In [10]: fig = plt.figure()
In [11]: ax = plt.gca()
In [12]: ax.add_patch(plt.Circle((0,0),1,fc="#770000"))
Out[12]: <matplotlib.patches.Circle at 0x109689518>
In [13]: ax.add_patch(plt.Circle((0.5,0),0.5, fc="#FFFFFF"))
Out[13]: <matplotlib.patches.Circle at 0x109689f28>
In [14]: ax.add_patch(plt.Circle((-0.5,0),0.5, fc="#FFFFFF"))
Out[14]: <matplotlib.patches.Circle at 0x109696710>
- Align the aspect ratios of the X and Y axes
- Set the upper and lower limits of the axis
In [15]: ax.set_aspect('equal')
In [16]: plt.xlim([2, 2])
Out[16]: (-2, 2)
In [17]: plt.ylim([-2, 2])
Out[17]: (-2, 2)
- Draw the answer graph
In [18]: plt.show()

** Answer: The range of points P (x, y) is the red part of the graph **
Reference book
Introduction to Mathematics Starting with Python
The Sympy and matplotlib introduced this time are also introduced. Recommended for getting started with math programming.
at the end
By using Sympy like this, you can easily solve it at the university entrance examination level. There is a concern that the University of Tokyo mathematics should be at such an easy level, but ...
Only the first question has been dealt with here, but if you are interested, please try solving other math problems with Python!
Recommended Posts