Mathématiques Todai 2016 résolues avec Python
introduction
Cet article est l'article du 11ème jour du Calendrier de l'Avent Python 2016.
Que faire ici
Le calendrier des événements Python de l'année dernière traitait des mathématiques IIB de l'examen du centre, mais cette année, nous traiterons des mathématiques de Todai (littérature).
- Les questions traitées dans cet article sont [Kawai Juku (établissement d'enseignement général / école préparatoire) / 2016 National Public University Secondary Examination / Private University Entrance Examination Answer Bulletin](http://kaisoku.kawai-juku.ac.jp/nyushi/ Il est cité de honshi / 16 / t01.html).
environnement
- Python 3.5.0
- Anaconda 3-2.4.0
Utilisation basique de Sympy
Qu'est-ce que Sympy?
Bibliothèque de calcul de symboles Python Document officiel: http://www.sympy.org/en/index.html Matériel japonais: http://www.turbare.net/transl/scipy-lecture-notes/packages/sympy.html
Définition des variables de symboles
In [1]: from sympy import *
In [2]: x + 1
---------------------------------------------------------------------------
NameError                                 Traceback (most recent call last)
<ipython-input-2-4cf92658b648> in <module>()
----> 1 x + 1

NameError: name 'x' is not defined

In [3]: x = symbols('x')
In [4]: x + 1
Out[4]: x + 1
développer - agrandir
In [5]: expand((x + 1)**2)
Out[5]: x**2 + 2*x + 1
facteur - factorisation
In [6]: factor(x**4 - 3*x**2 + 1)
Out[6]: (1 + x - x**2)*(1 - x - x**2)
simplifier - Simplifier
In [7]: simplify((x**3 + x**2 - x - 1)/(x**2 + 2*x + 1))
Out[7]: x - 1
limite --extrême
In [8]: limit(x, x, oo)
Out[8]: oo
diff-différenciation
In [9]: diff(cos(x), x)
Out[9]: -sin(x)
In [10]: diff(x**3 + x**2 - x - 1, x)
Out[10]: 3*x**2 + 2*x - 1
intégrer - intégrer
In [11]: integrate(cos(x), x)
Out[11]: sin(x)
In [12]: integrate(x**3 + x**2 - x - 1, x)
Out[12]: x**4/4 + x**3/3 - x**2/2 - x
Matrice-Matrice
In [13]: Matrix([[1, 2, 3], [-2, 0, 4]])
Out[13]:
Matrix([
[ 1, 2, 3],
[-2, 0, 4]])
résoudre - résoudre une expression
In [14]: solve(x**2 - 1, x)
Out[14]: [-1, 1]
question 1

- La variable xy est définie à l'aide de symboles
- Déposez chaque coordonnée PQR dans un vecteur à l'aide de Matrix
In [1]: import sympy as sy
In [2]: x, y = sy.symbols('x y')
In [3]: P = sy.Matrix([x, y])
In [4]: Q = sy.Matrix([-x, -y])
In [5]: R = sy.Matrix([1, 0])
- △ Exprimer la condition que PQR est un triangle pointu en utilisant le produit interne des vecteurs
- ∠ Si QPR est de 90 ° ou moins, $ \ vec {PQ} $ ・ $ \ vec {PR} $> 0
- ∠ Si PQR est de 90 ° ou moins, $ \ vec {QP} $ ・ $ \ vec {QR} $> 0
- ∠ Si PRQ est de 90 ° ou moins, $ \ vec {RP} $ ・ $ \ vec {RQ} $> 0
- Pour ceux qui veulent en savoir plus sur le produit intérieur et l'angle, ["Si vous pouvez voir le produit intérieur, vous pouvez voir les statistiques" Matériel de présentation du 5e Groupe d'étude des mathématiques pour les programmeurs](http://www.slideshare.net/matsukenbook/ 5-55326268) est recommandé
- $ \ Vec {PQ} $ ・ $ \ vec {PR} $ = PQ.norm () x PR.norm () x cos ∠QPR
normest la longueur du vecteur
In [6]: sy.simplify((Q - P).dot(R - P) > 0)
Out[6]: 2*x*(x - 1) + 2*y**2 > 0
In [7]: sy.simplify((P - Q).dot(R - Q) > 0)
Out[7]: 2*x*(x + 1) + 2*y**2 > 0
In [8]: sy.simplify((P - R).dot(Q - R) > 0)
Out[8]: -x**2 - y**2 + 1 > 0
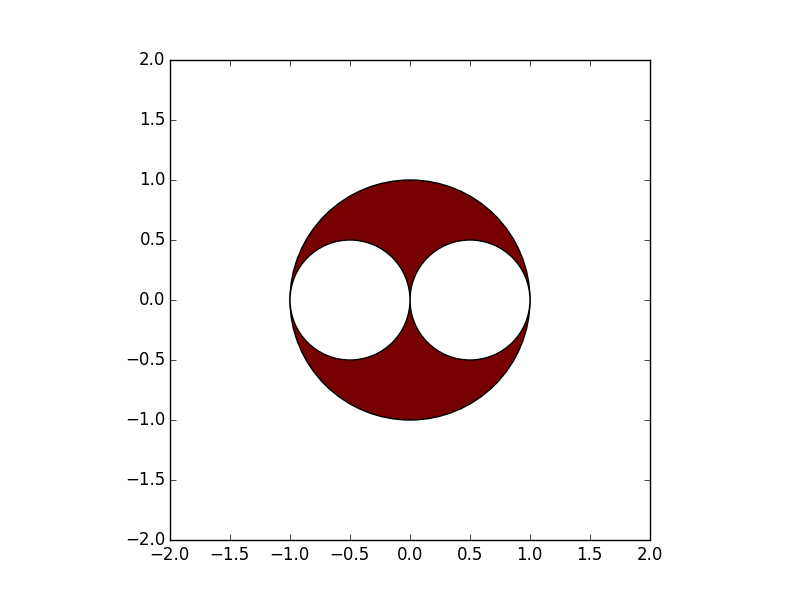
- Refactoriser les trois équations obtenues à partir de ceci pour faciliter la visualisation comme condition du cercle
2x(x-1)+2y^2 > 0 <=> (x-\frac{1}{2})^2+y^2 > \frac{1}{4}
2x(x+1)+2y^2 > 0 <=> (x+\frac{1}{2})^2+y^2 > \frac{1}{4}
-x^2 - y^2 + 1 > 0 <=> x^2+y^2 < 1
- Dessinez un graphique qui remplit cette condition
In [9]: import matplotlib.pyplot as plt
In [10]: fig = plt.figure()
In [11]: ax = plt.gca()
In [12]: ax.add_patch(plt.Circle((0,0),1,fc="#770000"))
Out[12]: <matplotlib.patches.Circle at 0x109689518>
In [13]: ax.add_patch(plt.Circle((0.5,0),0.5, fc="#FFFFFF"))
Out[13]: <matplotlib.patches.Circle at 0x109689f28>
In [14]: ax.add_patch(plt.Circle((-0.5,0),0.5, fc="#FFFFFF"))
Out[14]: <matplotlib.patches.Circle at 0x109696710>
- Aligner les proportions des axes X et Y
- Définir les limites supérieure et inférieure de l'axe
In [15]: ax.set_aspect('equal')
In [16]: plt.xlim([2, 2])
Out[16]: (-2, 2)
In [17]: plt.ylim([-2, 2])
Out[17]: (-2, 2)
- Dessinez le graphique de réponse
In [18]: plt.show()

** Réponse: La plage de points P (x, y) est la partie rouge du graphique **
Livre de référence
Introduction aux mathématiques à partir de Python
Sympy et matplotlib introduits cette fois sont également introduits. Recommandé comme point de départ pour la programmation mathématique.
à la fin
En utilisant Sympy comme celui-ci, vous pouvez facilement le résoudre au niveau de l'examen d'entrée à l'université. On craint que les mathématiques de l'Université de Tokyo soient à un niveau aussi facile, mais ...
Seule la première question a été traitée ici, mais si vous êtes intéressé, essayez de résoudre d'autres problèmes mathématiques avec Python!
Recommended Posts